Blackberry 2014 Annual Report Download - page 87
Download and view the complete annual report
Please find page 87 of the 2014 Blackberry annual report below. You can navigate through the pages in the report by either clicking on the pages listed below, or by using the keyword search tool below to find specific information within the annual report.-
 1
1 -
2
-
3
-
4
-
5
-
6
-
7
-
8
-
9
-
10
-
11
-
12
-
13
-
14
-
15
-
16
-
17
-
18
-
19
-
20
-
21
-
22
-
23
-
24
-
25
-
26
-
27
-
28
-
29
-
30
-
31
-
32
-
33
-
34
-
35
-
36
-
37
-
38
-
39
-
40
-
41
-
42
-
43
-
44
-
45
-
46
-
47
-
48
-
49
-
50
-
51
-
52
-
53
-
54
-
55
-
56
-
57
-
58
-
59
-
60
-
61
-
62
-
63
-
64
-
65
-
66
-
67
-
68
-
69
-
70
-
71
-
72
-
73
-
74
-
75
-
76
-
 77
77 -
 78
78 -
 79
79 -
 80
80 -
 81
81 -
 82
82 -
 83
83 -
 84
84 -
 85
85 -
 86
86 -
 87
87 -
 88
88 -
 89
89 -
 90
90 -
 91
91 -
 92
92 -
 93
93 -
 94
94 -
 95
95 -
 96
96 -
 97
97 -
98
-
99
-
100
-
101
-
102
-
103
-
104
-
105
-
106
-
107
-
108
-
109
-
110
-
111
-
112
-
113
-
114
-
115
-
116
-
117
-
118
-
119
-
120
-
121
-
122
-
123
-
124
-
125
-
126
-
127
-
128
-
129
-
130
-
131
-
132
-
133
-
134
-
135
-
136
-
137
-
138
-
139
-
140
-
141
-
142
-
143
-
144
-
145
-
146
-
147
-
148
-
149
-
150
-
151
-
152
-
153
-
154
-
155
-
156
-
157
-
158
-
159
-
160
-
161
-
162
-
163
-
164
-
165
-
166
-
167
-
168
-
169
-
170
-
171
-
172
-
173
-
174
-
175
-
176
-
177
-
178
-
179
-
180
 |
 |
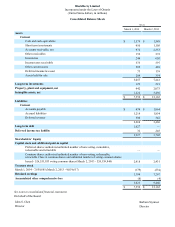
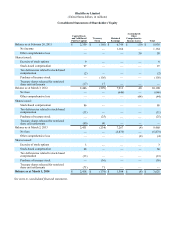
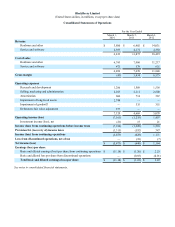
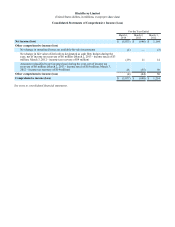
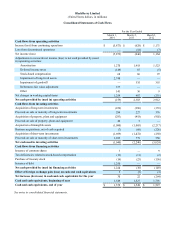
BlackBerry Limited
(United States dollars, in millions, except per share data)
Consolidated Statements of Operations
For the Year Ended
March 1,
2014 March 2,
2013 March 3,
2012
Revenue
Hardware and other $ 3,880 $ 6,902 $ 14,031
Service and software 2,933 4,171 4,392
6,813 11,073 18,423
Cost of sales
Hardware and other 6,383 7,060 11,217
Service and software 473 579 631
6,856 7,639 11,848
Gross margin (43) 3,434 6,575
Operating expenses
Research and development 1,286 1,509 1,556
Selling, marketing and administration 2,103 2,111 2,600
Amortization 606 714 567
Impairment of long-lived assets 2,748 — —
Impairment of goodwill — 335 355
Debentures fair value adjustment 377 — —
7,120 4,669 5,078
Operating income (loss) (7,163)(1,235) 1,497
Investment income (loss), net (21) 15 21
Income (loss) from continuing operations before income taxes (7,184)(1,220) 1,518
Provision for (recovery of) income taxes (1,311)(592) 347
Income (loss) from continuing operations (5,873)(628) 1,171
Loss from discontinued operations, net of tax —(18)(7)
Net income (loss) $(5,873) $ (646) $ 1,164
Earnings (loss) per share
Basic and diluted earnings (loss) per share from continuing operations $(11.18) $ (1.20) $ 2.23
Basic and diluted loss per share from discontinued operations —(0.03)(0.01)
Total basic and diluted earnings (loss) per share $(11.18) $ (1.23) $ 2.22
See notes to consolidated financial statements.