Blackberry 2014 Annual Report Download - page 145
Download and view the complete annual report
Please find page 145 of the 2014 Blackberry annual report below. You can navigate through the pages in the report by either clicking on the pages listed below, or by using the keyword search tool below to find specific information within the annual report.-
 1
1 -
2
-
3
-
4
-
5
-
6
-
7
-
8
-
9
-
10
-
11
-
12
-
13
-
14
-
15
-
16
-
17
-
18
-
19
-
20
-
21
-
22
-
23
-
24
-
25
-
26
-
27
-
28
-
29
-
30
-
31
-
32
-
33
-
34
-
35
-
36
-
37
-
38
-
39
-
40
-
41
-
42
-
43
-
44
-
45
-
46
-
47
-
48
-
49
-
50
-
51
-
52
-
53
-
54
-
55
-
56
-
57
-
58
-
59
-
60
-
61
-
62
-
63
-
64
-
65
-
66
-
67
-
68
-
69
-
70
-
71
-
72
-
73
-
74
-
75
-
76
-
77
-
78
-
79
-
80
-
81
-
82
-
83
-
84
-
85
-
86
-
87
-
88
-
89
-
90
-
91
-
92
-
93
-
94
-
95
-
96
-
97
-
98
-
99
-
100
-
101
-
102
-
103
-
104
-
105
-
106
-
107
-
108
-
109
-
110
-
111
-
112
-
113
-
114
-
115
-
116
-
117
-
118
-
119
-
120
-
121
-
122
-
123
-
124
-
125
-
126
-
127
-
128
-
129
-
130
-
131
-
132
-
133
-
134
-
 135
135 -
 136
136 -
 137
137 -
 138
138 -
 139
139 -
 140
140 -
 141
141 -
 142
142 -
 143
143 -
 144
144 -
 145
145 -
 146
146 -
 147
147 -
 148
148 -
 149
149 -
 150
150 -
 151
151 -
 152
152 -
 153
153 -
 154
154 -
 155
155 -
156
-
157
-
158
-
159
-
160
-
161
-
162
-
163
-
164
-
165
-
166
-
167
-
168
-
169
-
170
-
171
-
172
-
173
-
174
-
175
-
176
-
177
-
178
-
179
-
180
 |
 |
BlackBerry Limited
Management’s Discussion and Analysis of Financial Condition and Results of Operations
15
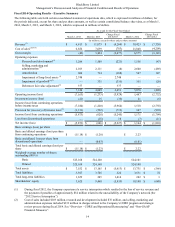
(3) Cost of sales included the Z10 Inventory Charge of approximately $934 million, the Q3 Fiscal 2014 Inventory Charge
of approximately $1.6 billion and the Q4 Fiscal 2014 Inventory Recovery incurred in fiscal 2014. See “Overview -
Inventory Charges” and “Non-GAAP Financial Measures”.
(4) During fiscal 2012, the Company recorded pre-tax charges on its inventory of BlackBerry PlayBooks of
approximately $485 million (the “PlayBook Inventory Charge”) and BlackBerry 7 smartphones of approximately
$267 million (the “2012 BlackBerry 7 Inventory Charge”).
(5) In the third quarter of fiscal 2014, the Company performed an LLA impairment test and based on the results of that
test, the Company recorded the LLA Impairment Charge of approximately $2.7 billion. See “Overview - Long-Lived
Asset Impairment Charge” and “Non-GAAP Financial Measures”.
(6) During fiscal 2013, the Company performed a goodwill impairment test and based on the results of that test, the
Company recorded a pre-tax goodwill impairment charge of approximately $335 million (the “2013 Goodwill
Impairment Charge”).
(7) During fiscal 2012, the Company performed a goodwill impairment test and based on the results of that test, the
Company recorded a pre-tax goodwill impairment charge of approximately $355 million (the “2012 Goodwill
Impairment Charge”).
(8) In fiscal 2014, the Company recorded a non-cash charge associated with the change in the fair value of the Debentures
of approximately $377 million, including a $382 million charge in the fourth quarter (the “Q4 Fiscal 2014 Debentures
Fair Value Adjustment”). See “Overview - Debentures Fair Value Adjustment” and “Non-GAAP Financial Measures”.
(9) During fiscal 2013, the Company recorded an income tax benefit of $166 million related to the settlement of uncertain
tax positions, including related interest and foreign exchange gains.
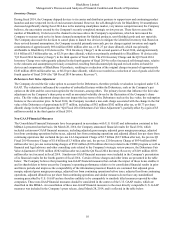
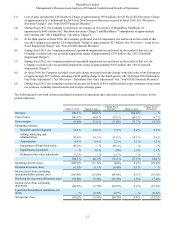
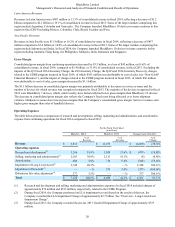
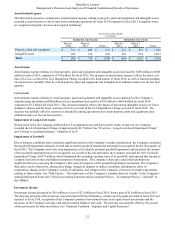
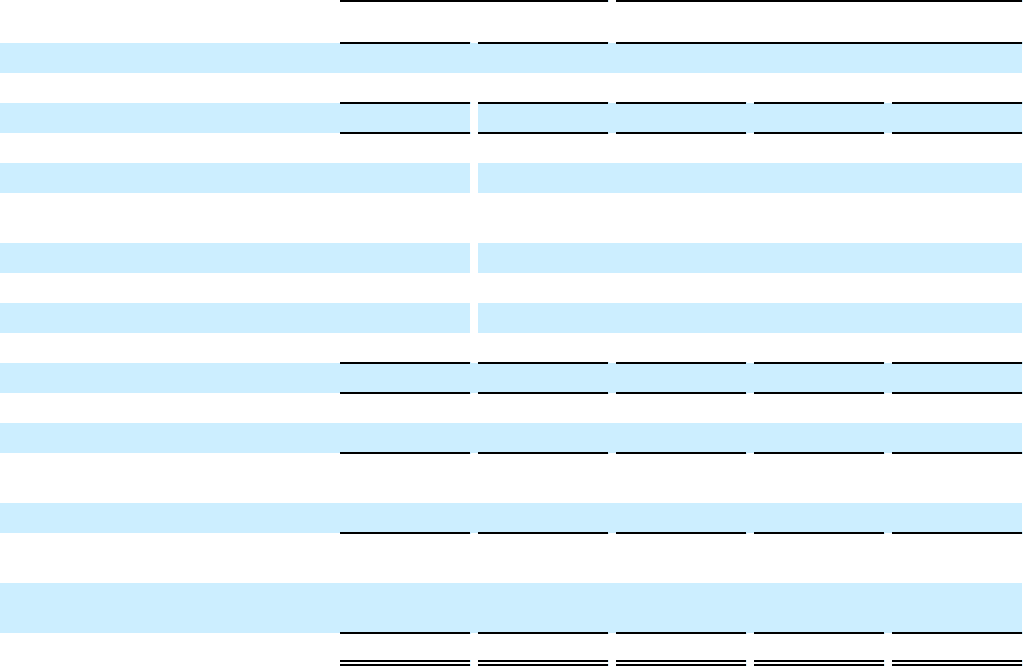
The following table sets forth certain consolidated statement of operations data expressed as a percentage of revenue for the
periods indicated:
March 1, 2014 March 2, 2013 Change Fiscal
2014/2013 March 3, 2012 Change Fiscal
2013/2012
Revenue 100.0 % 100.0 % — 100.0 % — %
Cost of sales 100.6 % 69.0 % 31.6 % 64.3 % 4.7 %
Gross margin (0.6)% 31.0 % (31.6)% 35.7 % (4.7)%
Operating expenses
Research and development 18.9 % 13.6 % 5.3 % 8.4 % 5.2 %
Selling, marketing and
administration 30.9 % 19.1 % 11.8 % 14.1 % 5.0 %
Amortization 8.9 % 6.4 % 2.5 % 3.1 % 3.3 %
Impairment of long-lived assets 40.3 % — % 40.3 % — % — %
Impairment of goodwill — % 3.0 % (3)% 1.9 % 1.1 %
Debentures fair value adjustment 5.5 % — % 5.5 % — % — %
104.5 % 42.1 % 62.4 % 27.5 % 14.6 %
Operating income (loss) (105.1)% (11.1)% (94)% 8.2 % (19.3)%
Investment income (loss) (0.3)% 0.1 % (0.4)% 0.1 % — %
Income (loss) from continuing
operations before income taxes (105.4)% (11.0)% (94.4)% 8.3 % (19.3)%
Provision for (recovery of) income taxes (19.2)% (5.3)% (13.9)% 1.9 % (7.2)%
Income (loss) from continuing
operations (86.2)% (5.7)% (80.5)% 6.4 % (12.1)%
Loss from discontinued operations, net
of tax — % (0.2)% 0.2 % — % (0.2)%
Net income (loss) (86.2)% (5.9)% (80.3)% 6.4 % (12.3)%