Blackberry 2014 Annual Report Download - page 122
Download and view the complete annual report
Please find page 122 of the 2014 Blackberry annual report below. You can navigate through the pages in the report by either clicking on the pages listed below, or by using the keyword search tool below to find specific information within the annual report.-
 1
1 -
2
-
3
-
4
-
5
-
6
-
7
-
8
-
9
-
10
-
11
-
12
-
13
-
14
-
15
-
16
-
17
-
18
-
19
-
20
-
21
-
22
-
23
-
24
-
25
-
26
-
27
-
28
-
29
-
30
-
31
-
32
-
33
-
34
-
35
-
36
-
37
-
38
-
39
-
40
-
41
-
42
-
43
-
44
-
45
-
46
-
47
-
48
-
49
-
50
-
51
-
52
-
53
-
54
-
55
-
56
-
57
-
58
-
59
-
60
-
61
-
62
-
63
-
64
-
65
-
66
-
67
-
68
-
69
-
70
-
71
-
72
-
73
-
74
-
75
-
76
-
77
-
78
-
79
-
80
-
81
-
82
-
83
-
84
-
85
-
86
-
87
-
88
-
89
-
90
-
91
-
92
-
93
-
94
-
95
-
96
-
97
-
98
-
99
-
100
-
101
-
102
-
103
-
104
-
105
-
106
-
107
-
108
-
109
-
110
-
111
-
 112
112 -
 113
113 -
 114
114 -
 115
115 -
 116
116 -
 117
117 -
 118
118 -
 119
119 -
 120
120 -
 121
121 -
 122
122 -
 123
123 -
 124
124 -
 125
125 -
 126
126 -
 127
127 -
 128
128 -
 129
129 -
 130
130 -
 131
131 -
 132
132 -
133
-
134
-
135
-
136
-
137
-
138
-
139
-
140
-
141
-
142
-
143
-
144
-
145
-
146
-
147
-
148
-
149
-
150
-
151
-
152
-
153
-
154
-
155
-
156
-
157
-
158
-
159
-
160
-
161
-
162
-
163
-
164
-
165
-
166
-
167
-
168
-
169
-
170
-
171
-
172
-
173
-
174
-
175
-
176
-
177
-
178
-
179
-
180
 |
 |
BlackBerry Limited
Notes to the Consolidated Financial Statements
In millions of United States dollars, except share and per share data, and except as otherwise indicated
33
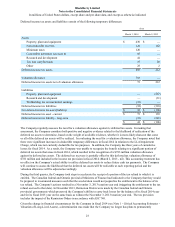
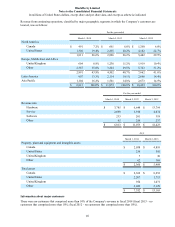
have been classified as held for sale on the Company’s consolidated balance sheets as at March 1, 2014, valued at $209
million (March 2, 2013 - $354 million), the lower of carrying value and fair value less costs to sell. Further, the Company
has recorded losses of approximately $110 million in fiscal 2014 (nil in fiscal 2013) related to the write-down to fair value
less costs to sell of the assets held for sale. Assets held for sale are expected to be sold within the next twelve months.
In fiscal 2013, the Company sold 100% of the shares of its wholly-owned subsidiary, NewBay Software Limited
(“NewBay”) and as a result, the operating results of NewBay are presented as discontinued operations in the Company's
consolidated statements of operations for the fiscal years ended March 2, 2013 and March 3, 2012.
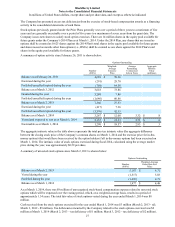
The following table sets forth the components of the Company’s loss from discontinued operations:
March 2, 2013 March 3, 2012
Revenues from discontinued operations $ 33 $ 12
Loss from discontinued operations, before tax (20)(7)
Loss on disposal of discontinued operation (3) —
Income tax recovery 5 —
Loss from discontinued operations, net of tax $(18) $ (7)
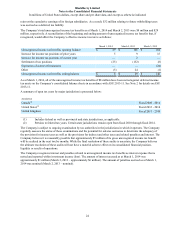
Carrying values of significant assets and liabilities of NewBay at the time of sale include property, plant and equipment
and intangible assets of $41 million, current assets of $15 million and accrued liabilities of $13 million.
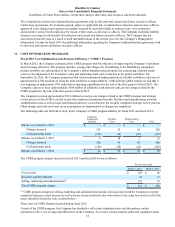
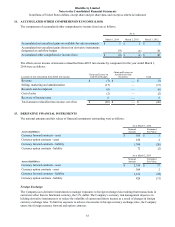
Fiscal 2012 Cost Optimization Program
In June 2011, the Company initiated a cost optimization program (the "2012 Cost Optimization Program") that included a
global workforce reduction of approximately 2,000 employees, representing approximately 10% of the total global
workforce. The Company incurred approximately $125 million in total pre-tax charges related to the 2012 Cost
Optimization Program in fiscal 2012. All of the pre-tax charges were related to one-time employee termination benefits,
and the identification of redundant facilities. During fiscal 2013 and fiscal 2014 the Company made cash payments related
to employee termination benefits and facilities costs, as shown in the table below. No further charges are expected to be
incurred under this plan.
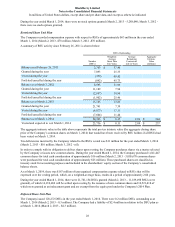
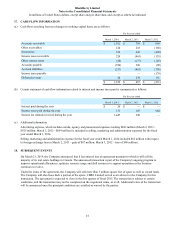
The following table sets forth the activity in the Company’s 2012 Cost Optimization Program liability for fiscal 2013 and
fiscal 2014:
Employee
Termination
Benefits Facilities
Costs Total
Balance as at March 3, 2012 $ 10 $ 44 $ 54
Cash payments made (10)(24)(34)
Balance as at March 2, 2013 — 20 20
Cash payments made —(9)(9)
Balance as at March 1, 2014 $ — $ 11 $ 11
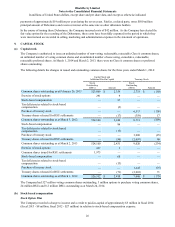
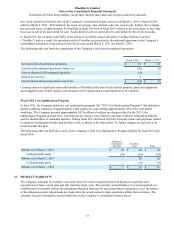
12. PRODUCT WARRANTY
The Company estimates its warranty costs at the time of revenue recognition based on historical experience and
expectations of future return rates and unit warranty repair costs. The warranty accrual balance is reviewed quarterly to
establish that it materially reflects the remaining obligation based on the anticipated future expenditures over the balance
of the obligation period. Adjustments are made when the actual warranty claim experience differs from estimates. The
warranty accrual is included in accrued liabilities on the Company’s consolidated balance sheets.