Blackberry 2014 Annual Report Download - page 140
Download and view the complete annual report
Please find page 140 of the 2014 Blackberry annual report below. You can navigate through the pages in the report by either clicking on the pages listed below, or by using the keyword search tool below to find specific information within the annual report.-
 1
1 -
2
-
3
-
4
-
5
-
6
-
7
-
8
-
9
-
10
-
11
-
12
-
13
-
14
-
15
-
16
-
17
-
18
-
19
-
20
-
21
-
22
-
23
-
24
-
25
-
26
-
27
-
28
-
29
-
30
-
31
-
32
-
33
-
34
-
35
-
36
-
37
-
38
-
39
-
40
-
41
-
42
-
43
-
44
-
45
-
46
-
47
-
48
-
49
-
50
-
51
-
52
-
53
-
54
-
55
-
56
-
57
-
58
-
59
-
60
-
61
-
62
-
63
-
64
-
65
-
66
-
67
-
68
-
69
-
70
-
71
-
72
-
73
-
74
-
75
-
76
-
77
-
78
-
79
-
80
-
81
-
82
-
83
-
84
-
85
-
86
-
87
-
88
-
89
-
90
-
91
-
92
-
93
-
94
-
95
-
96
-
97
-
98
-
99
-
100
-
101
-
102
-
103
-
104
-
105
-
106
-
107
-
108
-
109
-
110
-
111
-
112
-
113
-
114
-
115
-
116
-
117
-
118
-
119
-
120
-
121
-
122
-
123
-
124
-
125
-
126
-
127
-
128
-
129
-
 130
130 -
 131
131 -
 132
132 -
 133
133 -
 134
134 -
 135
135 -
 136
136 -
 137
137 -
 138
138 -
 139
139 -
 140
140 -
 141
141 -
 142
142 -
 143
143 -
 144
144 -
 145
145 -
 146
146 -
 147
147 -
 148
148 -
 149
149 -
 150
150 -
151
-
152
-
153
-
154
-
155
-
156
-
157
-
158
-
159
-
160
-
161
-
162
-
163
-
164
-
165
-
166
-
167
-
168
-
169
-
170
-
171
-
172
-
173
-
174
-
175
-
176
-
177
-
178
-
179
-
180
 |
 |
BlackBerry Limited
Management’s Discussion and Analysis of Financial Condition and Results of Operations
10
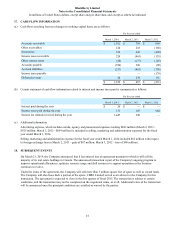
Inventory Charges
During fiscal 2014, the Company shipped devices to its carrier and distributor partners to support new and continuing product
launches and meet expected levels of end customer demand. However, the sell-through levels for BlackBerry 10 smartphones
decreased significantly during fiscal 2014 due to the maturing smartphone market, very intense competition and, the Company
believes, the uncertainty created by the Company's recently completed strategic review process. These factors caused the
number of BlackBerry 10 devices in the channel to increase above the Company's expectations, which in turn caused the
Company to reassess and revise its future demand assumptions for finished products, semi-finished goods and raw materials.
The Company also made the decision to cancel plans to launch two devices to mitigate the identified inventory risk. Based on
these revised demand assumptions, the Company recorded primarily non-cash, pre-tax charges against inventory and supply
commitments of approximately $934 million ($666 million after tax, or $1.27 per share diluted), which was primarily
attributable to BlackBerry Z10 devices (the “Z10 Inventory Charge”) in the second quarter of fiscal 2014, and approximately
$1.6 billion ($1.3 billion after tax, or $2.56 per share diluted), which was primarily attributable to BlackBerry 10 devices (the
“Q3 Fiscal 2014 Inventory Charge”) in the third quarter of fiscal 2014. The Z10 Inventory Charge and the Q3 Fiscal 2014
Inventory Charge were subsequently adjusted in the fourth quarter of fiscal 2014 to reflect increased sell through rates, relative
to the estimates and assumptions previously considered, resulting from discounted pricing and revised orders on hand for
devices and components of BlackBerry 10 products, resulting in a reduction of the original charges incurred of approximately
$149 million ($106 million after tax, or $0.20 per share diluted), which was recorded as a reduction of cost of goods sold in the
fourth quarter of fiscal 2014 (the “Q4 Fiscal 2014 Inventory Recovery”).
Debentures Fair Value Adjustment
The Company elected the fair value option to account for the Debentures, therefore periodic revaluation is required under U.S.
GAAP. The valuation is influenced by a number of embedded features within the Debentures, such as the Company’s put
option on the debt and the conversion option for the investors, among others. The primary factors that influence the fair value
adjustment are the Company’s share price as well as associated volatility driven by the fluctuation of the Company’s share
price. The fair value adjustment charge does not impact the key terms of the Debentures such as the face value, the redemption
features or the conversion price. In fiscal 2014, the Company recorded a non-cash charge associated with the change in the fair
value of the Debentures of approximately $377 million, including a $382 million ($382 million after tax, or $0.73 per share
diluted) charge in the fourth quarter (the “Q4 Fiscal 2014 Debentures Fair Value Adjustment”), partially offset by a gain of $5
million recorded in the third quarter of fiscal 2014.
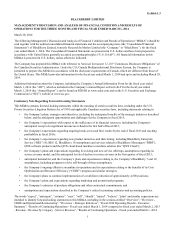
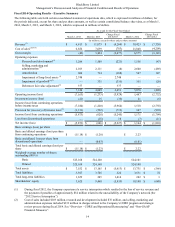
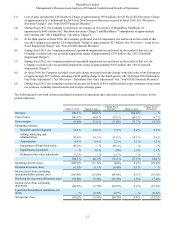
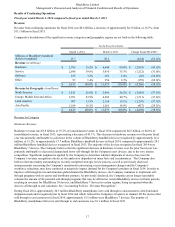
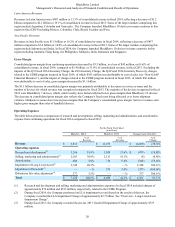
Non-GAAP Financial Measures
The Consolidated Financial Statements have been prepared in accordance with U.S. GAAP, and information contained in this
MD&A is presented on that basis. On March 28, 2014, the Company announced financial results for fiscal 2014, which
included certain non-GAAP financial measures, including adjusted gross margin, adjusted gross margin percentage, adjusted
loss from continuing operations before taxes, adjusted loss from continuing operations and adjusted diluted loss per share from
continuing operations that excluded the pre-tax LLA Impairment Charge of $2.7 billion ($2.5 billion after tax), the pre-tax Q3
Fiscal 2014 Inventory Charge of $1.6 billion ($1.3 billion after tax), the pre-tax Z10 Inventory Charge of $934 million ($666
million after tax), pre-tax restructuring charges of $512 million ($398 million after tax) related to the CORE program as well as
financial and legal advisory and other consulting costs related to the Company's strategic review process, the Debentures Fair
Value Adjustment of $382 million ($382 million after tax) and the Q4 Fiscal 2014 Inventory Recovery of $149 million ($106
million after tax) incurred in fiscal 2014. Similar non-GAAP financial measures were included in the Company’s presentation
of its financial results for the fourth quarter of fiscal 2014. Certain of these charges and other items are presented in the table
below. The Company believes that presenting non-GAAP financial measures that exclude the impact of those items enables it
and its shareholders to better assess the Company’s operating performance relative to its consolidated financial results in prior
and future periods and improves the comparability of the information presented. Readers are cautioned that adjusted gross
margin, adjusted gross margin percentage, adjusted loss from continuing operations before taxes, adjusted loss from continuing
operations, adjusted diluted loss per share from continuing operations and similar measures do not have any standardized
meaning prescribed by U.S. GAAP and are therefore unlikely to be comparable to similarly titled measures reported by other
companies. These non-GAAP financial measures should be considered in the context of the U.S. GAAP results, which are
described in this MD&A. A reconciliation of these non-GAAP financial measures to the most directly comparable U.S. GAAP
measures was included in the Company’s press release, dated March 28, 2014, and is reflected in the table below.