Blackberry 2014 Annual Report Download - page 101
Download and view the complete annual report
Please find page 101 of the 2014 Blackberry annual report below. You can navigate through the pages in the report by either clicking on the pages listed below, or by using the keyword search tool below to find specific information within the annual report.-
 1
1 -
2
-
3
-
4
-
5
-
6
-
7
-
8
-
9
-
10
-
11
-
12
-
13
-
14
-
15
-
16
-
17
-
18
-
19
-
20
-
21
-
22
-
23
-
24
-
25
-
26
-
27
-
28
-
29
-
30
-
31
-
32
-
33
-
34
-
35
-
36
-
37
-
38
-
39
-
40
-
41
-
42
-
43
-
44
-
45
-
46
-
47
-
48
-
49
-
50
-
51
-
52
-
53
-
54
-
55
-
56
-
57
-
58
-
59
-
60
-
61
-
62
-
63
-
64
-
65
-
66
-
67
-
68
-
69
-
70
-
71
-
72
-
73
-
74
-
75
-
76
-
77
-
78
-
79
-
80
-
81
-
82
-
83
-
84
-
85
-
86
-
87
-
88
-
89
-
90
-
 91
91 -
 92
92 -
 93
93 -
 94
94 -
 95
95 -
 96
96 -
 97
97 -
 98
98 -
 99
99 -
 100
100 -
 101
101 -
 102
102 -
 103
103 -
 104
104 -
 105
105 -
 106
106 -
 107
107 -
 108
108 -
 109
109 -
 110
110 -
 111
111 -
112
-
113
-
114
-
115
-
116
-
117
-
118
-
119
-
120
-
121
-
122
-
123
-
124
-
125
-
126
-
127
-
128
-
129
-
130
-
131
-
132
-
133
-
134
-
135
-
136
-
137
-
138
-
139
-
140
-
141
-
142
-
143
-
144
-
145
-
146
-
147
-
148
-
149
-
150
-
151
-
152
-
153
-
154
-
155
-
156
-
157
-
158
-
159
-
160
-
161
-
162
-
163
-
164
-
165
-
166
-
167
-
168
-
169
-
170
-
171
-
172
-
173
-
174
-
175
-
176
-
177
-
178
-
179
-
180
 |
 |
BlackBerry Limited
Notes to the Consolidated Financial Statements
In millions of United States dollars, except share and per share data, and except as otherwise indicated
12
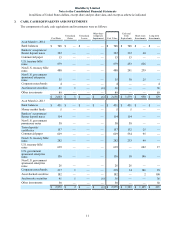
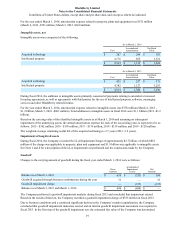
As at March 1, 2014, the Company's other investments consisted of cost method investments of $4 million (March 2,
2013 -$4 million) and equity method investments of $85 million (March 2, 2013 -$46 million).
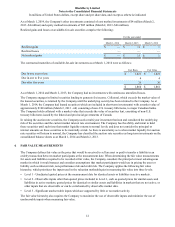
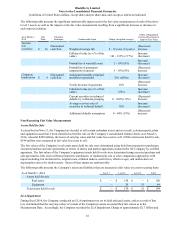
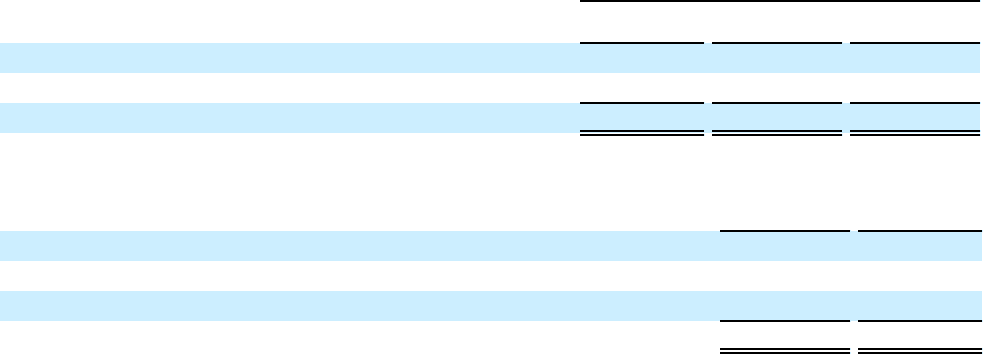
Realized gains and losses on available-for-sale securities comprise the following:
For the year ended
March 1, 2014 March 2, 2013 March 3, 2012
Realized gains $ — $ 11 $ 1
Realized losses ———
Net realized gains $ — $ 11 $ 1
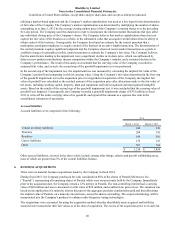
The contractual maturities of available-for-sale investments as at March 1, 2014 were as follows:
Cost Basis Fair Value
Due in one year or less $ 1,821 $ 1,821
Due in one to five years 4 4
Due after five years 35 36
$ 1,860 $ 1,861
As at March 1, 2014 and March 2, 2013, the Company had no investments with continuous unrealized losses.
The Company engages in limited securities lending to generate fee income. Collateral, which exceeds the market value of
the loaned securities, is retained by the Company until the underlying security has been returned to the Company. As at
March 1, 2014, the Company had loaned securities (which are included in short-term investments) with a market value of
approximately $100 million (March 2, 2013 - nil) consisting of non-U.S. treasury bills/notes, to major Canadian banks.
The Company holds collateral with a market value that exceeds the value of securities lent, consisting of non-U.S.
treasury bills/notes issued by the federal and provincial governments of Canada.
In valuing the auction rate securities, the Company used a multi-year investment horizon and considered the underlying
risk of the securities and the current market interest rate environment. The Company has the ability and intent to hold
these securities until such time that market liquidity returns to normal levels, and does not consider the principal or
interest amounts on these securities to be materially at risk. As there is uncertainty as to when market liquidity for auction
rate securities will return to normal, the Company has classified the auction rate securities as long-term investments on the
consolidated balance sheets as at March 1, 2014 and March 2, 2013.
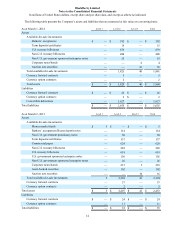
4. FAIR VALUE MEASUREMENTS
The Company defines fair value as the price that would be received to sell an asset or paid to transfer a liability in an
orderly transaction between market participants at the measurement date. When determining the fair value measurements
for assets and liabilities required to be recorded at fair value, the Company considers the principal or most advantageous
market in which it would transact and considers assumptions that market participants would use in pricing the asset or
liability such as inherent risk, non-performance risk and credit risk. The Company applies the following fair value
hierarchy, which prioritizes the inputs used in the valuation methodologies in measuring fair value into three levels:
• Level 1 - Unadjusted quoted prices at the measurement date for identical assets or liabilities in active markets.
• Level 2 - Observable inputs other than quoted prices included in Level 1, such as quoted prices for similar assets and
liabilities in active markets; quoted prices for identical or similar assets and liabilities in markets that are not active; or
other inputs that are observable or can be corroborated by observable market data.
• Level 3 - Significant unobservable inputs which are supported by little or no market activity.
The fair value hierarchy also requires the Company to maximize the use of observable inputs and minimize the use of
unobservable inputs when measuring fair value.