Blackberry 2014 Annual Report Download - page 154
Download and view the complete annual report
Please find page 154 of the 2014 Blackberry annual report below. You can navigate through the pages in the report by either clicking on the pages listed below, or by using the keyword search tool below to find specific information within the annual report.-
 1
1 -
2
-
3
-
4
-
5
-
6
-
7
-
8
-
9
-
10
-
11
-
12
-
13
-
14
-
15
-
16
-
17
-
18
-
19
-
20
-
21
-
22
-
23
-
24
-
25
-
26
-
27
-
28
-
29
-
30
-
31
-
32
-
33
-
34
-
35
-
36
-
37
-
38
-
39
-
40
-
41
-
42
-
43
-
44
-
45
-
46
-
47
-
48
-
49
-
50
-
51
-
52
-
53
-
54
-
55
-
56
-
57
-
58
-
59
-
60
-
61
-
62
-
63
-
64
-
65
-
66
-
67
-
68
-
69
-
70
-
71
-
72
-
73
-
74
-
75
-
76
-
77
-
78
-
79
-
80
-
81
-
82
-
83
-
84
-
85
-
86
-
87
-
88
-
89
-
90
-
91
-
92
-
93
-
94
-
95
-
96
-
97
-
98
-
99
-
100
-
101
-
102
-
103
-
104
-
105
-
106
-
107
-
108
-
109
-
110
-
111
-
112
-
113
-
114
-
115
-
116
-
117
-
118
-
119
-
120
-
121
-
122
-
123
-
124
-
125
-
126
-
127
-
128
-
129
-
130
-
131
-
132
-
133
-
134
-
135
-
136
-
137
-
138
-
139
-
140
-
141
-
142
-
143
-
 144
144 -
 145
145 -
 146
146 -
 147
147 -
 148
148 -
 149
149 -
 150
150 -
 151
151 -
 152
152 -
 153
153 -
 154
154 -
 155
155 -
 156
156 -
 157
157 -
 158
158 -
 159
159 -
 160
160 -
 161
161 -
 162
162 -
 163
163 -
 164
164 -
165
-
166
-
167
-
168
-
169
-
170
-
171
-
172
-
173
-
174
-
175
-
176
-
177
-
178
-
179
-
180
 |
 |
BlackBerry Limited
Management’s Discussion and Analysis of Financial Condition and Results of Operations
24
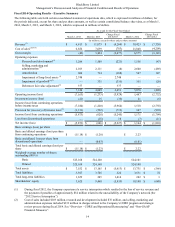
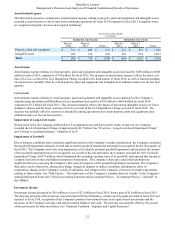
is primarily due to decreases in service revenue and the number of devices for which revenue was recognized compared to
fiscal 2013 and also reflects the Company's fixed costs being allocated over lower shipment volumes. Hardware revenues have
lower gross margins than the Company’s consolidated gross margin. Service revenues earn higher gross margins than sales of
handheld devices.
The weighted average number of shares outstanding was 525 million common shares for basic and diluted loss per share for the
fiscal year ended March 1, 2014 and 524 million common shares for both basic and diluted loss per share for the fiscal year
ended March 2, 2013.
Common Shares Outstanding
On March 24, 2014, there were 527 million voting common shares, options to purchase 3 million voting common shares, 24
million restricted share units and 0.2 million deferred share units outstanding.
The Company has not paid any cash dividends during the last three fiscal years.
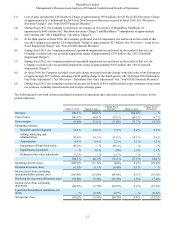
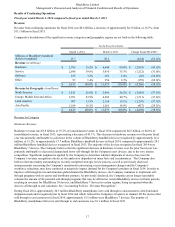
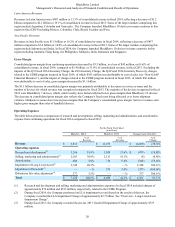
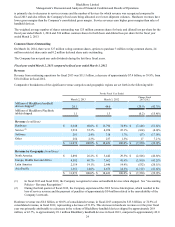
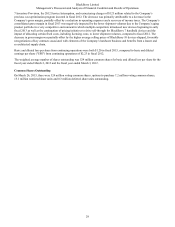
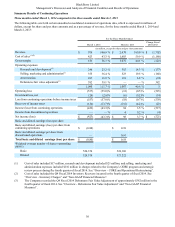
Fiscal year ended March 2, 2013 compared to fiscal year ended March 3, 2012
Revenue
Revenue from continuing operations for fiscal 2013 was $11.1 billion, a decrease of approximately $7.4 billion, or 39.9%, from
$18.4 billion in fiscal 2012.
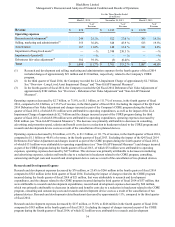
Comparative breakdowns of the significant revenue categories and geographic regions are set forth in the following table:
For the Fiscal Year Ended
March 2, 2013 March 3, 2012 Change Fiscal
2013/2012
Millions of BlackBerry handheld
devices shipped(1) 28.1 49.0 (20.9) (42.7)%
Millions of BlackBerry PlayBook
tablets shipped 1.1 1.3 (0.2) (15.4)%
Revenue (in millions)
Hardware $ 6,648 60.0% $ 13,794 74.9% $ (7,146) (51.8)%
Service (2) 3,910 35.3% 4,074 22.1% (164) (4.0)%
Software 261 2.4% 318 1.7% (57) (17.9)%
Other 254 2.3% 237 1.3% 17 7.2 %
$ 11,073 100.0% $ 18,423 100.0% $ (7,350) (39.9)%
Revenue by Geography (in millions)
North America $ 2,896 26.2% $ 5,442 29.5% $ (2,546) (46.8)%
Europe, Middle East and Africa 4,502 40.7% 7,662 41.6% (3,160) (41.2)%
Latin America 2,114 19.1% 2,646 14.4% (532) (20.1)%
Asia Pacific 1,561 14.0% 2,673 14.5% (1,112) (41.6)%
$ 11,073 100.0% $ 18,423 100.0% $ (7,350) (39.9)%
(1) In fiscal 2013 and fiscal 2012, the Company recognized revenue on handheld devices when shipped. See "Accounting
Policies - Revenue Recognition."
(2) During the third quarter of fiscal 2012, the Company experienced the 2012 Service Interruption, which resulted in the
loss of service revenue and the payment of penalties of approximately $54 million related to the unavailability of the
Company’s network.
Hardware revenue was $6.6 billion, or 60.0% of consolidated revenue, in fiscal 2013 compared to $13.8 billion, or 74.9% of
consolidated revenue, in fiscal 2012, representing a decrease of 51.8%. This decrease in hardware revenue over the prior fiscal
year was primarily attributable to a decrease in the volume of BlackBerry handheld devices shipped by approximately 20.9
million, or 42.7%, to approximately 28.1 million BlackBerry handheld devices in fiscal 2013, compared to approximately 49.0