Blackberry 2014 Annual Report Download - page 103
Download and view the complete annual report
Please find page 103 of the 2014 Blackberry annual report below. You can navigate through the pages in the report by either clicking on the pages listed below, or by using the keyword search tool below to find specific information within the annual report.-
 1
1 -
2
-
3
-
4
-
5
-
6
-
7
-
8
-
9
-
10
-
11
-
12
-
13
-
14
-
15
-
16
-
17
-
18
-
19
-
20
-
21
-
22
-
23
-
24
-
25
-
26
-
27
-
28
-
29
-
30
-
31
-
32
-
33
-
34
-
35
-
36
-
37
-
38
-
39
-
40
-
41
-
42
-
43
-
44
-
45
-
46
-
47
-
48
-
49
-
50
-
51
-
52
-
53
-
54
-
55
-
56
-
57
-
58
-
59
-
60
-
61
-
62
-
63
-
64
-
65
-
66
-
67
-
68
-
69
-
70
-
71
-
72
-
73
-
74
-
75
-
76
-
77
-
78
-
79
-
80
-
81
-
82
-
83
-
84
-
85
-
86
-
87
-
88
-
89
-
90
-
91
-
92
-
 93
93 -
 94
94 -
 95
95 -
 96
96 -
 97
97 -
 98
98 -
 99
99 -
 100
100 -
 101
101 -
 102
102 -
 103
103 -
 104
104 -
 105
105 -
 106
106 -
 107
107 -
 108
108 -
 109
109 -
 110
110 -
 111
111 -
 112
112 -
 113
113 -
114
-
115
-
116
-
117
-
118
-
119
-
120
-
121
-
122
-
123
-
124
-
125
-
126
-
127
-
128
-
129
-
130
-
131
-
132
-
133
-
134
-
135
-
136
-
137
-
138
-
139
-
140
-
141
-
142
-
143
-
144
-
145
-
146
-
147
-
148
-
149
-
150
-
151
-
152
-
153
-
154
-
155
-
156
-
157
-
158
-
159
-
160
-
161
-
162
-
163
-
164
-
165
-
166
-
167
-
168
-
169
-
170
-
171
-
172
-
173
-
174
-
175
-
176
-
177
-
178
-
179
-
180
 |
 |
BlackBerry Limited
Notes to the Consolidated Financial Statements
In millions of United States dollars, except share and per share data, and except as otherwise indicated
14
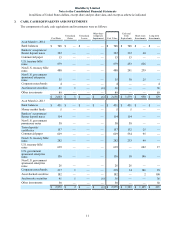
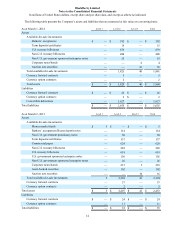
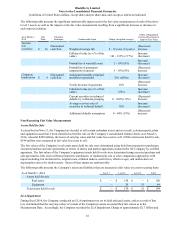
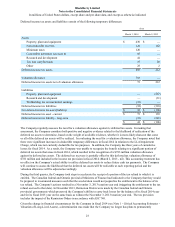
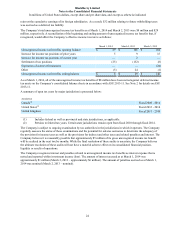
The following table presents the Company’s assets and liabilities that are measured at fair value on a recurring basis:
As at March 1, 2014 Level 1 Level 2 Level 3 Total
Assets
Available-for-sale investments
Bankers’ acceptances $ — $ 392 $ — $ 392
Term deposits/certificates — 15 — 15
U.S. treasury bills/notes — 879 — 879
Non-U.S. treasury bills/notes — 480 — 480
Non-U.S. government sponsored enterprise notes — 55 — 55
Corporate notes/bonds — — 4 4
Auction rate securities — — 36 36
Total available-for-sale investments — 1,821 40 1,861
Currency forward contracts — 5 — 5
Currency option contracts — 2 — 2
Total assets $ — $ 1,828 $ 40 $ 1,868
Liabilities
Currency forward contracts $ — $ 26 $ — $ 26
Currency option contracts — 2 $ — 2
Convertible debentures — 1,627 — 1,627
Total liabilities $ — $ 1,655 $ — $ 1,655
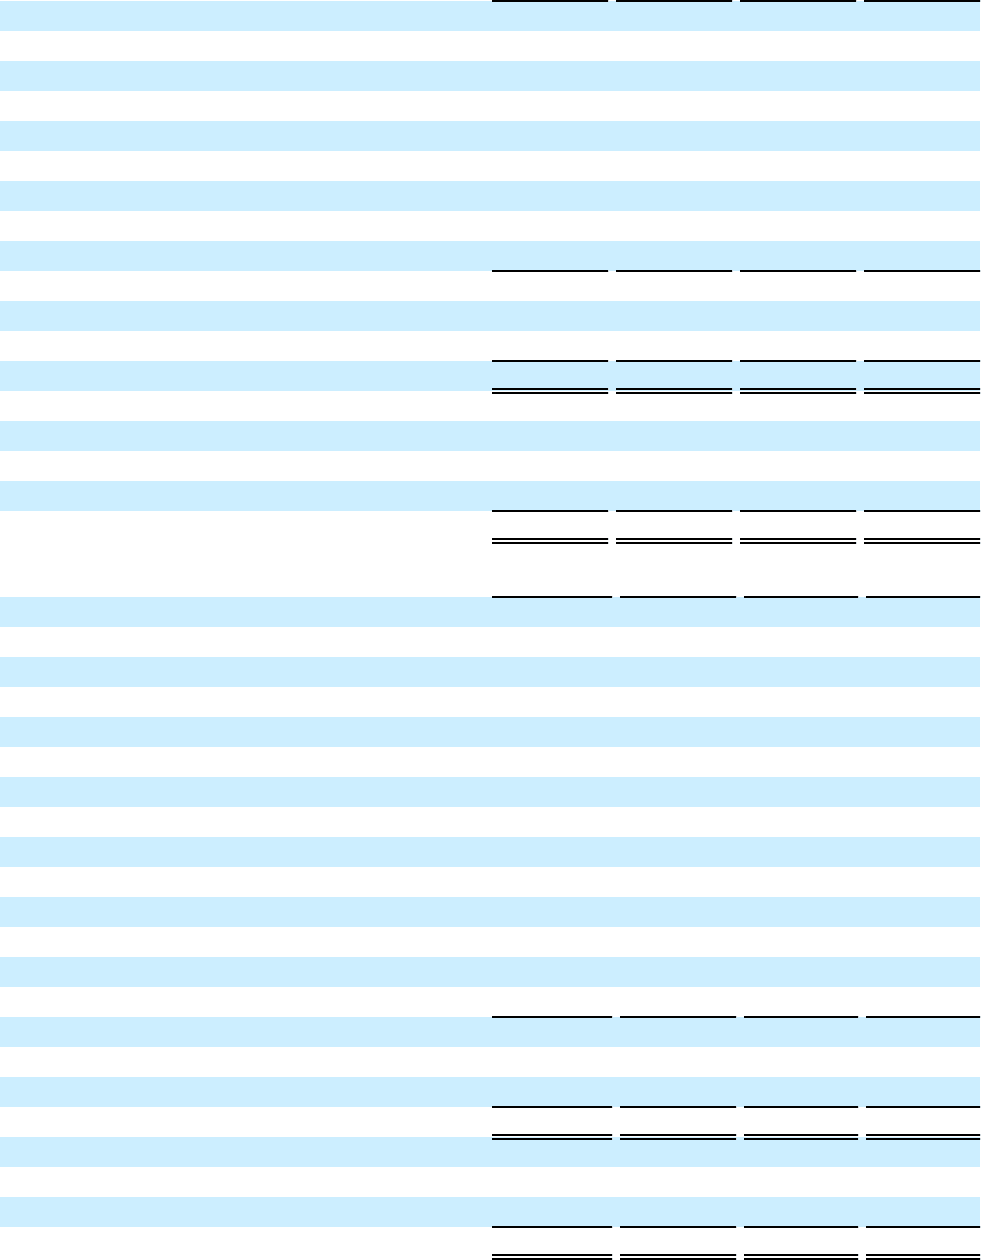
As at March 2, 2013 Level 1 Level 2 Level 3 Total
Assets
Available-for-sale investments
Money market funds $ 5 $ — $ — $ 5
Bankers’ acceptances/Bearer deposit notes — 114 — 114
Non-U.S. government promissory notes — 50 — 50
Term deposits/certificates — 157 — 157
Commercial paper — 629 — 629
Non-U.S. treasury bills/notes — 282 — 282
U.S. treasury bills/notes — 619 — 619
U.S. government sponsored enterprise notes — 156 — 156
Non-U.S. government sponsored enterprise notes — 26 — 26
Corporate notes/bonds — 213 5 218
Asset-backed securities — 102 — 102
Auction rate securities — — 36 36
Total available-for-sale investments 5 2,348 41 2,394
Currency forward contracts — 57 — 57
Currency option contracts — 2 — 2
Total assets $ 5 $ 2,407 $ 41 $ 2,453
Liabilities
Currency forward contracts $ — $ 24 $ — $ 24
Currency option contracts — 11 — 11
Total liabilities $ — $ 35 $ — $ 35