Blackberry 2014 Annual Report Download - page 105
Download and view the complete annual report
Please find page 105 of the 2014 Blackberry annual report below. You can navigate through the pages in the report by either clicking on the pages listed below, or by using the keyword search tool below to find specific information within the annual report.-
 1
1 -
2
-
3
-
4
-
5
-
6
-
7
-
8
-
9
-
10
-
11
-
12
-
13
-
14
-
15
-
16
-
17
-
18
-
19
-
20
-
21
-
22
-
23
-
24
-
25
-
26
-
27
-
28
-
29
-
30
-
31
-
32
-
33
-
34
-
35
-
36
-
37
-
38
-
39
-
40
-
41
-
42
-
43
-
44
-
45
-
46
-
47
-
48
-
49
-
50
-
51
-
52
-
53
-
54
-
55
-
56
-
57
-
58
-
59
-
60
-
61
-
62
-
63
-
64
-
65
-
66
-
67
-
68
-
69
-
70
-
71
-
72
-
73
-
74
-
75
-
76
-
77
-
78
-
79
-
80
-
81
-
82
-
83
-
84
-
85
-
86
-
87
-
88
-
89
-
90
-
91
-
92
-
93
-
94
-
 95
95 -
 96
96 -
 97
97 -
 98
98 -
 99
99 -
 100
100 -
 101
101 -
 102
102 -
 103
103 -
 104
104 -
 105
105 -
 106
106 -
 107
107 -
 108
108 -
 109
109 -
 110
110 -
 111
111 -
 112
112 -
 113
113 -
 114
114 -
 115
115 -
116
-
117
-
118
-
119
-
120
-
121
-
122
-
123
-
124
-
125
-
126
-
127
-
128
-
129
-
130
-
131
-
132
-
133
-
134
-
135
-
136
-
137
-
138
-
139
-
140
-
141
-
142
-
143
-
144
-
145
-
146
-
147
-
148
-
149
-
150
-
151
-
152
-
153
-
154
-
155
-
156
-
157
-
158
-
159
-
160
-
161
-
162
-
163
-
164
-
165
-
166
-
167
-
168
-
169
-
170
-
171
-
172
-
173
-
174
-
175
-
176
-
177
-
178
-
179
-
180
 |
 |

BlackBerry Limited
Notes to the Consolidated Financial Statements
In millions of United States dollars, except share and per share data, and except as otherwise indicated
16
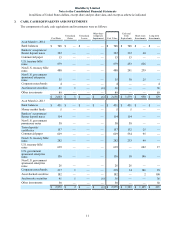
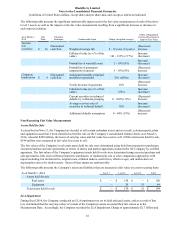
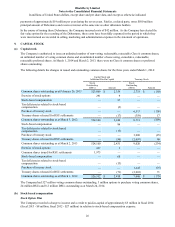
The following table presents the significant unobservable inputs used in the fair value measurement of each of the above
Level 3 assets, as well as the impact on the fair value measurement resulting from a significant increase or decrease in
each input in isolation:
As at March 1,
2014 Fair
Value Valuation
Technique Unobservable Input Range (weighted average)
Effect of Significant
Increase/(Decrease) in
Input on Fair Value
Auction
rate
securities $ 36 Discounted
cash flow Weighted-average life 8 - 19 years (14 years) (Decrease)/
increase
Collateral value (as a % of fair
value) 101 - 133% (117%) Increase/
(decrease)
Probability of waterfall event 5 - 10% (8%) Increase/
(decrease)
Probability of permanent
suspension of auction 5 - 10% (8%) (Decrease)/
increase
Corporate
bonds/notes $ 4 Discounted
cash flow Anticipated monthly principal
and interest payments $0.1 million Increase/
(decrease)
Yearly decrease in payments 10% (Decrease)/
increase
Collateral value (as a % of fair
value) 138% Increase/
(decrease)
Current securities in technical
default, by collateral grouping 0 - 100% (13%) (Decrease)/
increase
Average recovery rate of
securities in technical default 30% Increase/
(decrease)
Additional defaults assumption 0 - 44% (18%) (Decrease)/
increase
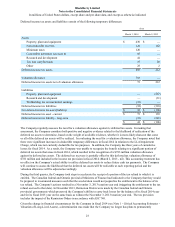
Non-Recurring Fair Value Measurements
Assets Held for Sale
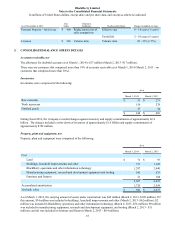
As described in Note 11, the Company has decided to sell certain redundant assets and as a result, certain property, plant
and equipment assets have been classified as held for sale on the Company’s consolidated balance sheets as at March 1,
2014, valued at $209 million, the lower of carrying value and fair value less costs to sell. Of the total assets held for sale,
$194 million were measured at fair value less costs to sell.
The fair values of the Company’s real estate assets held for sale were determined using bids from prospective purchasers,
executed purchase and sale agreements or letters of intent, and market appraisals conducted for the Company by certified
appraisers. The fair values of the Company’s equipment assets held for sale were determined using executed purchase and
sale agreements, bids received from prospective purchasers, or replacement cost or sales comparison approaches with
inputs including, but not limited to, original costs, inflation indices, useful lives, effective ages, and market-derived
depreciation curves for similar assets. Some of these inputs are unobservable.
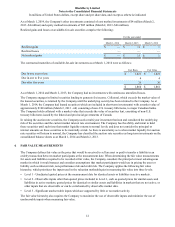
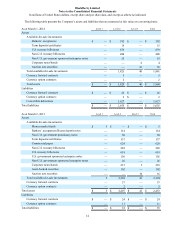
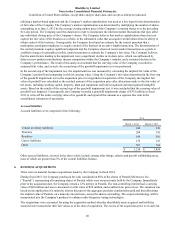
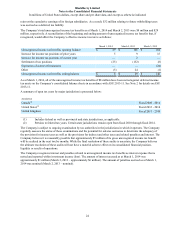
The following table presents the Company’s assets and liabilities that are measured at fair value on a non-recurring basis:
As at March 1, 2014 Level 1 Level 2 Level 3 Total
Assets held for sale
Real estate $ — $ 150 $ — $ 150
Equipment — 29 15 44
Total assets held for sale $ — $ 179 $ 15 $ 194
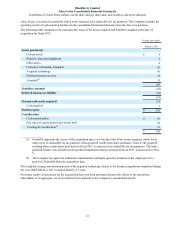
LLA Impairment
During fiscal 2014, the Company conducted an LLA impairment test on its held and used assets, and as a result of that
test, determined that the carrying values of certain of the Company's assets exceeded their fair values as at the
Measurement Date. Accordingly, the Company recorded the LLA Impairment Charge of approximately $2.7 billion and