Blackberry 2014 Annual Report Download - page 146
Download and view the complete annual report
Please find page 146 of the 2014 Blackberry annual report below. You can navigate through the pages in the report by either clicking on the pages listed below, or by using the keyword search tool below to find specific information within the annual report.-
 1
1 -
2
-
3
-
4
-
5
-
6
-
7
-
8
-
9
-
10
-
11
-
12
-
13
-
14
-
15
-
16
-
17
-
18
-
19
-
20
-
21
-
22
-
23
-
24
-
25
-
26
-
27
-
28
-
29
-
30
-
31
-
32
-
33
-
34
-
35
-
36
-
37
-
38
-
39
-
40
-
41
-
42
-
43
-
44
-
45
-
46
-
47
-
48
-
49
-
50
-
51
-
52
-
53
-
54
-
55
-
56
-
57
-
58
-
59
-
60
-
61
-
62
-
63
-
64
-
65
-
66
-
67
-
68
-
69
-
70
-
71
-
72
-
73
-
74
-
75
-
76
-
77
-
78
-
79
-
80
-
81
-
82
-
83
-
84
-
85
-
86
-
87
-
88
-
89
-
90
-
91
-
92
-
93
-
94
-
95
-
96
-
97
-
98
-
99
-
100
-
101
-
102
-
103
-
104
-
105
-
106
-
107
-
108
-
109
-
110
-
111
-
112
-
113
-
114
-
115
-
116
-
117
-
118
-
119
-
120
-
121
-
122
-
123
-
124
-
125
-
126
-
127
-
128
-
129
-
130
-
131
-
132
-
133
-
134
-
135
-
 136
136 -
 137
137 -
 138
138 -
 139
139 -
 140
140 -
 141
141 -
 142
142 -
 143
143 -
 144
144 -
 145
145 -
 146
146 -
 147
147 -
 148
148 -
 149
149 -
 150
150 -
 151
151 -
 152
152 -
 153
153 -
 154
154 -
 155
155 -
 156
156 -
157
-
158
-
159
-
160
-
161
-
162
-
163
-
164
-
165
-
166
-
167
-
168
-
169
-
170
-
171
-
172
-
173
-
174
-
175
-
176
-
177
-
178
-
179
-
180
 |
 |
BlackBerry Limited
Management’s Discussion and Analysis of Financial Condition and Results of Operations
16
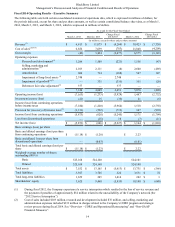
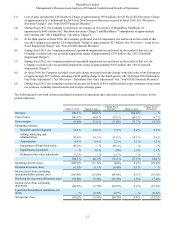
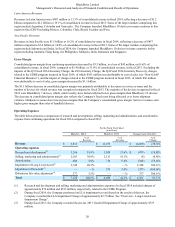
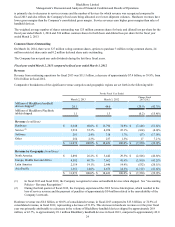
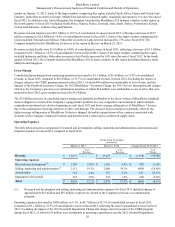
Revenue from continuing operations for fiscal 2014 was $6.8 billion, a decrease of approximately $4.3 billion, or 38.5%, from
$11.1 billion in fiscal 2013. Hardware revenue decreased by $2.9 billion, or 43.1%, to $3.8 billion. The Company believes that
the significant decrease in hardware revenue over the prior fiscal year was primarily attributable to decreased demand and
lower sell-through for the Company's new devices, due to the very intense competition. The Company also believes that
uncertainty surrounding its recently completed strategic review process, as well as previously disclosed announcements
concerning the Company's operational restructuring, recent management changes and the Company's workforce reductions,
may have continued to negatively impact demand for the Company's products in fiscal 2014. The number of BlackBerry
handheld devices recognized decreased by approximately 14.4 million, or 51.2%, to approximately 13.7 million in fiscal 2014,
compared to approximately 28.1 million in fiscal 2013. The majority of the devices recognized in fiscal 2014 were BlackBerry
7 devices. During fiscal 2014, approximately 20.5 million (fiscal 2013 - 36.1 million) BlackBerry smartphones were sold
through to end customers, which included shipments made and recognized prior to fiscal 2014 and which reduced the
Company's inventory in channel. Of the devices that sold through to end customers in fiscal 2014, approximately 15.5 million
were BlackBerry 7 devices. Service revenue decreased by $1.2 billion to $2.7 billion in fiscal 2014, which was primarily
attributable to a lower number of BlackBerry users and lower revenue from those users, compared to fiscal 2013. The decrease
also reflects the impact of a $240 million service revenue deferral related to carriers in Venezuela (the “Fiscal 2014 Venezuela
Service Revenue Deferral”) and a $13 million service revenue deferral related to carriers in Argentina (the "Q4 Fiscal 2014
Argentina Service Revenue Deferral") as discussed in “Results of Continuing Operations - Fiscal year ended March 1, 2014
compared to fiscal year ended March 2, 2013 - Revenue - Revenue by Category - Service Revenue”. The Company expects
service revenue to decline in the first quarter of fiscal 2015 by a percentage consistent with the decline experienced in the
fourth quarter of fiscal 2014. Software revenue decreased by $26 million in fiscal 2014 to $235 million, compared to $261
million in fiscal 2013, which was primarily attributable to decreases in technical support and CAL revenues, partially offset by
an increase in QNX revenue. Other revenue decreased by $159 million to $95 million in fiscal 2014 compared to fiscal 2013,
which was primarily attributable to non-warranty repair revenue and also reflects gains on revenue hedging instruments
experienced in fiscal 2013 and not repeated in fiscal 2014 as well as decreases in licensing and accessory revenues.
The Company’s net loss from continuing operations for fiscal 2014 was $5.9 billion, or $11.18 per share (basic and diluted),
reflecting an an unfavourable increase in net loss of $5.2 billion compared to net loss from continuing operations of $628
million, or $1.20 per share (basic and diluted), in fiscal 2013. The increase in net loss takes into account the non-cash LLA
Impairment Charge, the primarily non-cash Q3 Fiscal 2014 Inventory Charge, the non-cash Z10 Inventory Charge, the non-
cash Q4 Fiscal 2014 Debentures Fair Value Adjustment, restructuring charges of approximately $398 million, after tax, related
to the Company’s CORE program and strategic review process, and the Q4 Fiscal 2014 Inventory Recovery incurred in fiscal
2014 (see “Non-GAAP Financial Measures”) as well as the impact of an income tax benefit of $166 million related to the
settlement of uncertain tax positions, including related interest and foreign exchange gains, the non-cash 2013 Goodwill
Impairment Charge and restructuring charges of approximately $151 million, after tax, incurred in fiscal 2013. The
unfavourable increase in net loss is also attributable to a decrease in the Company’s gross margin, partially offset by an increase
in the recovery of income taxes and a reduction in operating expenditures. The decrease in consolidated gross margin was
primarily attributable to decreases in service revenue and the number of devices for which revenue was recognized compared to
fiscal 2013. The decrease in consolidated gross margin also reflects the Company's fixed costs being allocated over lower
shipment volumes. Hardware revenues have lower gross margins than the Company’s consolidated gross margin. Service
revenues earn higher gross margins than sales of handheld devices.
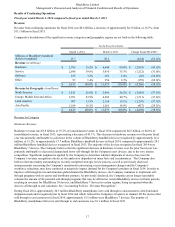
In the first quarter of fiscal 2015, the Company anticipates maintaining its strong cash position and continuing to look for
opportunities to streamline operations. The Company is targeting break-even cash flow results by the end of fiscal 2015 and
reaching profitability in fiscal 2016.
A more comprehensive analysis of these factors is contained in “Results of Continuing Operations”.