Blackberry 2014 Annual Report Download - page 129
Download and view the complete annual report
Please find page 129 of the 2014 Blackberry annual report below. You can navigate through the pages in the report by either clicking on the pages listed below, or by using the keyword search tool below to find specific information within the annual report.-
 1
1 -
2
-
3
-
4
-
5
-
6
-
7
-
8
-
9
-
10
-
11
-
12
-
13
-
14
-
15
-
16
-
17
-
18
-
19
-
20
-
21
-
22
-
23
-
24
-
25
-
26
-
27
-
28
-
29
-
30
-
31
-
32
-
33
-
34
-
35
-
36
-
37
-
38
-
39
-
40
-
41
-
42
-
43
-
44
-
45
-
46
-
47
-
48
-
49
-
50
-
51
-
52
-
53
-
54
-
55
-
56
-
57
-
58
-
59
-
60
-
61
-
62
-
63
-
64
-
65
-
66
-
67
-
68
-
69
-
70
-
71
-
72
-
73
-
74
-
75
-
76
-
77
-
78
-
79
-
80
-
81
-
82
-
83
-
84
-
85
-
86
-
87
-
88
-
89
-
90
-
91
-
92
-
93
-
94
-
95
-
96
-
97
-
98
-
99
-
100
-
101
-
102
-
103
-
104
-
105
-
106
-
107
-
108
-
109
-
110
-
111
-
112
-
113
-
114
-
115
-
116
-
117
-
118
-
 119
119 -
 120
120 -
 121
121 -
 122
122 -
 123
123 -
 124
124 -
 125
125 -
 126
126 -
 127
127 -
 128
128 -
 129
129 -
 130
130 -
 131
131 -
 132
132 -
 133
133 -
 134
134 -
 135
135 -
 136
136 -
 137
137 -
 138
138 -
 139
139 -
140
-
141
-
142
-
143
-
144
-
145
-
146
-
147
-
148
-
149
-
150
-
151
-
152
-
153
-
154
-
155
-
156
-
157
-
158
-
159
-
160
-
161
-
162
-
163
-
164
-
165
-
166
-
167
-
168
-
169
-
170
-
171
-
172
-
173
-
174
-
175
-
176
-
177
-
178
-
179
-
180
 |
 |
BlackBerry Limited
Notes to the Consolidated Financial Statements
In millions of United States dollars, except share and per share data, and except as otherwise indicated
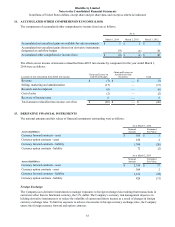
40
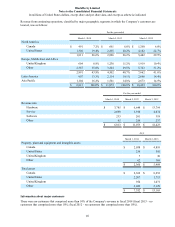
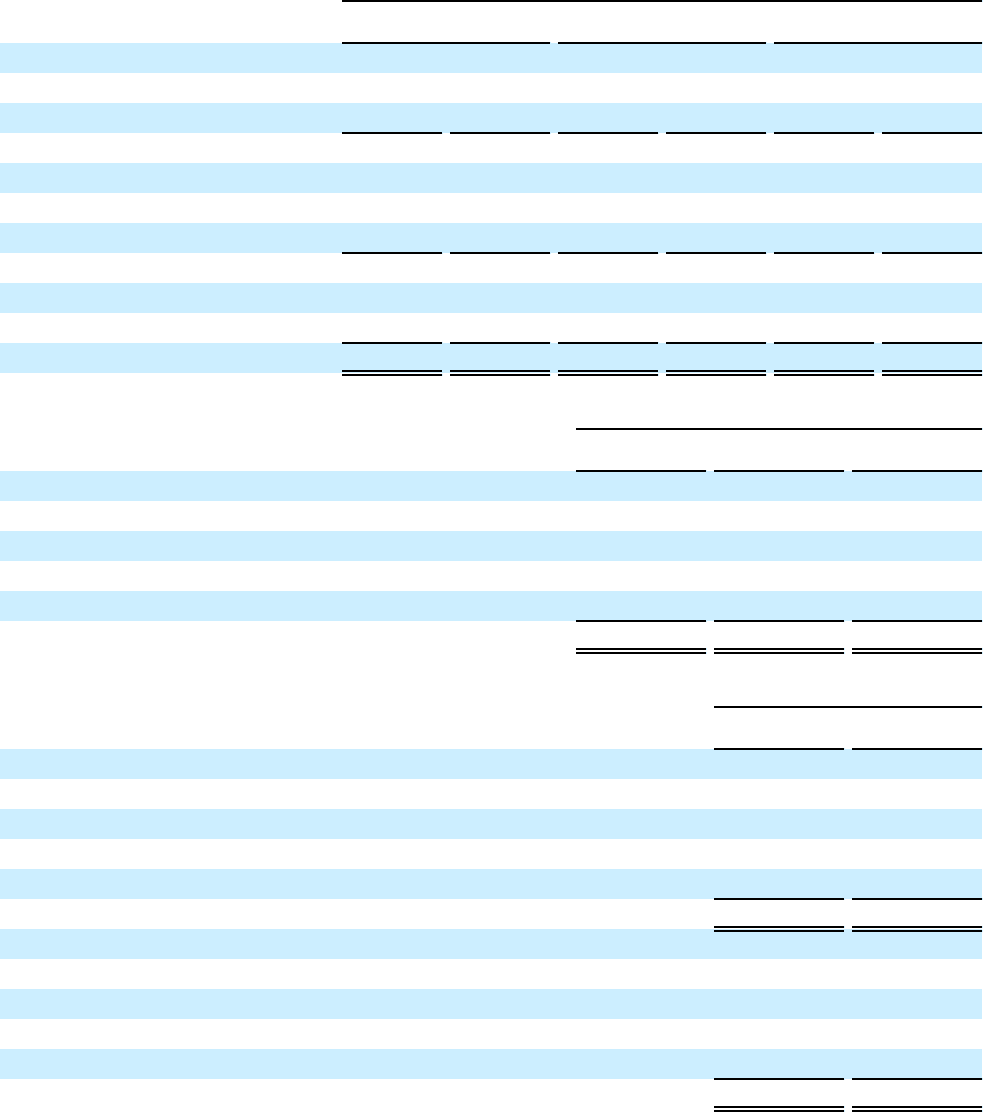
Revenue from continuing operations, classified by major geographic segments in which the Company’s customers are
located, was as follows:
For the year ended
March 1, 2014 March 2, 2013 March 3, 2012
North America
Canada $ 491 7.2% $ 661 6.0% $ 1,260 6.8%
United States 1,320 19.4% 2,235 20.2% 4,182 22.7%
1,811 26.6% 2,896 26.2% 5,442 29.5%
Europe, Middle East and Africa
United Kingdom 604 8.9% 1,238 11.2% 1,919 10.4%
Other 2,387 35.0% 3,264 29.5% 5,743 31.2%
2,991 43.9% 4,502 40.7% 7,662 41.6%
Latin America 907 13.3% 2,114 19.1% 2,646 14.4%
Asia Pacific 1,104 16.2% 1,561 14.0% 2,673 14.5%
$ 6,813 100.0% $ 11,073 100.0% $ 18,423 100.0%
For the year ended
March 1, 2014 March 2, 2013 March 3, 2012
Revenue mix
Hardware $ 3,785 $ 6,648 $ 13,794
Service 2,698 3,910 4,074
Software 235 261 318
Other 95 254 237
$ 6,813 $ 11,073 $ 18,423
As at
March 1, 2014 March 2, 2013
Property, plant and equipment and intangible assets
Canada $ 2,058 $ 4,895
United States 239 395
United Kingdom 7 30
Other 62 169
$ 2,366 $ 5,489
Total assets
Canada $ 2,362 $ 8,252
United States 2,207 1,713
United Kingdom 954 1,071
Other 2,029 2,129
$ 7,552 $ 13,165
Information about major customers
There were no customers that comprised more than 10% of the Company’s revenue in fiscal 2014 (fiscal 2013 – no
customers that comprised more than 10%; fiscal 2012 – no customers that comprised more than 10%).