Blackberry 2014 Annual Report Download - page 160
Download and view the complete annual report
Please find page 160 of the 2014 Blackberry annual report below. You can navigate through the pages in the report by either clicking on the pages listed below, or by using the keyword search tool below to find specific information within the annual report.-
 1
1 -
2
-
3
-
4
-
5
-
6
-
7
-
8
-
9
-
10
-
11
-
12
-
13
-
14
-
15
-
16
-
17
-
18
-
19
-
20
-
21
-
22
-
23
-
24
-
25
-
26
-
27
-
28
-
29
-
30
-
31
-
32
-
33
-
34
-
35
-
36
-
37
-
38
-
39
-
40
-
41
-
42
-
43
-
44
-
45
-
46
-
47
-
48
-
49
-
50
-
51
-
52
-
53
-
54
-
55
-
56
-
57
-
58
-
59
-
60
-
61
-
62
-
63
-
64
-
65
-
66
-
67
-
68
-
69
-
70
-
71
-
72
-
73
-
74
-
75
-
76
-
77
-
78
-
79
-
80
-
81
-
82
-
83
-
84
-
85
-
86
-
87
-
88
-
89
-
90
-
91
-
92
-
93
-
94
-
95
-
96
-
97
-
98
-
99
-
100
-
101
-
102
-
103
-
104
-
105
-
106
-
107
-
108
-
109
-
110
-
111
-
112
-
113
-
114
-
115
-
116
-
117
-
118
-
119
-
120
-
121
-
122
-
123
-
124
-
125
-
126
-
127
-
128
-
129
-
130
-
131
-
132
-
133
-
134
-
135
-
136
-
137
-
138
-
139
-
140
-
141
-
142
-
143
-
144
-
145
-
146
-
147
-
148
-
149
-
 150
150 -
 151
151 -
 152
152 -
 153
153 -
 154
154 -
 155
155 -
 156
156 -
 157
157 -
 158
158 -
 159
159 -
 160
160 -
 161
161 -
 162
162 -
 163
163 -
 164
164 -
 165
165 -
 166
166 -
 167
167 -
 168
168 -
 169
169 -
 170
170 -
171
-
172
-
173
-
174
-
175
-
176
-
177
-
178
-
179
-
180
 |
 |
BlackBerry Limited
Management’s Discussion and Analysis of Financial Condition and Results of Operations
30
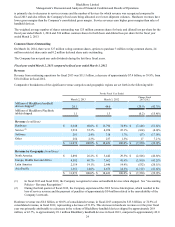
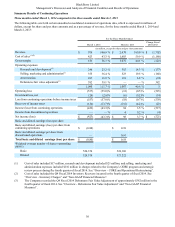
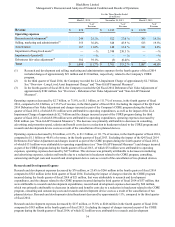
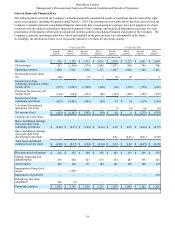
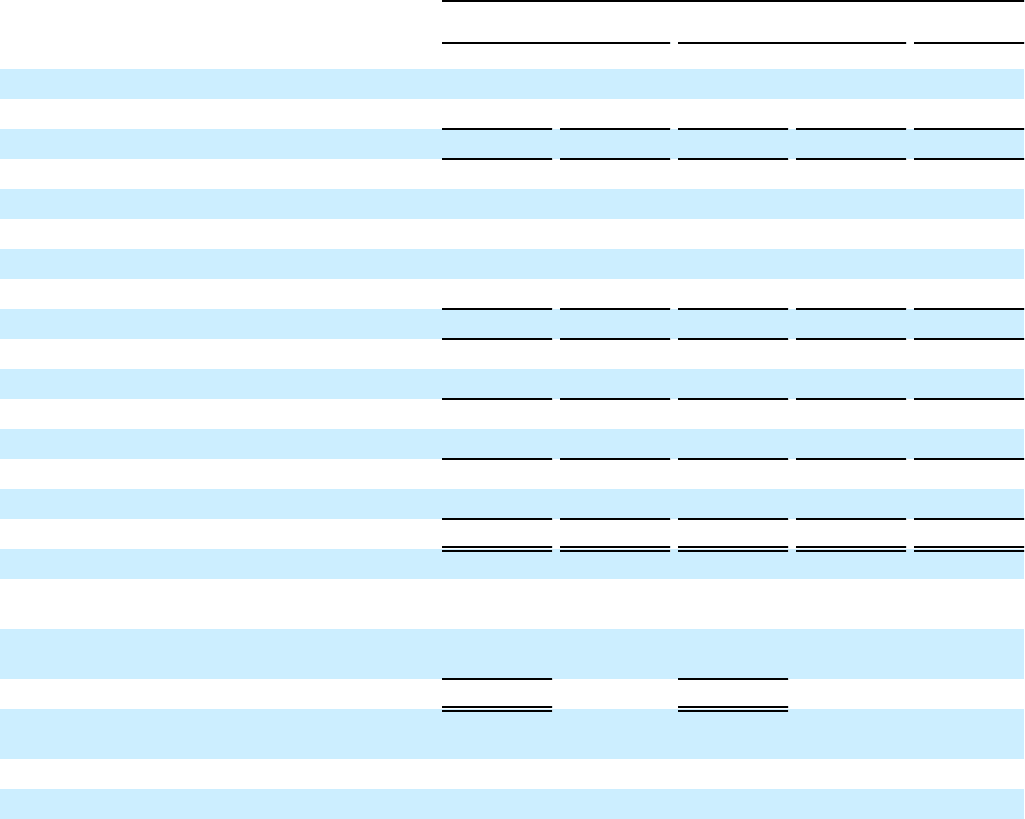
Summary Results of Continuing Operations
Three months ended March 1, 2014 compared to the three months ended March 2, 2013
The following table sets forth certain unaudited consolidated statement of operations data, which is expressed in millions of
dollars, except for share and per share amounts and as a percentage of revenue, for the three months ended March 1, 2014 and
March 2, 2013:
For the Three Months Ended
March 1, 2014 March 2, 2013 Change Fiscal
2014/2013
(in million, except for share and per share amounts)
Revenue $ 976 100.0 % $ 2,678 100.0 % $ (1,702)
Cost of sales (1)(2) 423 43.3 % 1,603 59.9 % (1,180)
Gross margin 553 56.7 % 1,075 40.1 % (522)
Operating expenses
Research and development(1) 246 25.2 % 383 14.3 % (137)
Selling, marketing and administration(1) 355 36.4 % 523 19.5 % (168)
Amortization 107 11.0 % 181 6.8 % (74)
Debentures fair value adjustment(3) 382 39.1 % — — % 382
1,090 111.7 % 1,087 40.6 % 3
Operating loss (537) (55.0)% (12) (0.5)% (525)
Investment loss, net (20) (2.0)% (6) (0.2)% (14)
Loss from continuing operations before income taxes (557) (57.0)% (18) (0.7)% (539)
Recovery of income taxes (134) (13.7)% (112) (4.2)% (22)
Income (loss) from continuing operations (423) (43.3)% 94 3.5 % (517)
Income from discontinued operations — — % 4 0.2 % (4)
Net income (loss) $(423) (43.3)% $ 98 3.7 % $ (521)
Basic and diluted earnings (loss) per share
Basic and diluted earnings (loss) per share from
continuing operations $(0.80) $ 0.18
Basic and diluted earnings per share from
discontinued operations — 0.01
Total basic and diluted earnings (loss) per share $(0.80) $ 0.19
Weighted-average number of shares outstanding
(000’s)
Basic 526,374 524,160
Diluted 526,374 527,222
(1) Cost of sales included $17 million, research and development included $21 million, and selling, marketing and
administration expenses included $110 million in charges related to the Company’s CORE program and strategic
review process during fhe fourth quarter of fiscal 2014. See “Overview – CORE and Operational Restructuring”.
(2) Cost of sales included the Q4 Fiscal 2014 Inventory Recovery incurred in the fourth quarter of fiscal 2014. See
“Overview - Inventory Charges” and “Non-GAAP Financial Measures”.
(3) The Company recorded the Q4 Fiscal 2014 Debentures Fair Value Adjustment of approximately $382 million in the
fourth quarter of fiscal 2014. See “Overview - Debentures Fair Value Adjustment” and “Non-GAAP Financial
Measures”.