Blackberry 2014 Annual Report Download - page 169
Download and view the complete annual report
Please find page 169 of the 2014 Blackberry annual report below. You can navigate through the pages in the report by either clicking on the pages listed below, or by using the keyword search tool below to find specific information within the annual report.-
 1
1 -
2
-
3
-
4
-
5
-
6
-
7
-
8
-
9
-
10
-
11
-
12
-
13
-
14
-
15
-
16
-
17
-
18
-
19
-
20
-
21
-
22
-
23
-
24
-
25
-
26
-
27
-
28
-
29
-
30
-
31
-
32
-
33
-
34
-
35
-
36
-
37
-
38
-
39
-
40
-
41
-
42
-
43
-
44
-
45
-
46
-
47
-
48
-
49
-
50
-
51
-
52
-
53
-
54
-
55
-
56
-
57
-
58
-
59
-
60
-
61
-
62
-
63
-
64
-
65
-
66
-
67
-
68
-
69
-
70
-
71
-
72
-
73
-
74
-
75
-
76
-
77
-
78
-
79
-
80
-
81
-
82
-
83
-
84
-
85
-
86
-
87
-
88
-
89
-
90
-
91
-
92
-
93
-
94
-
95
-
96
-
97
-
98
-
99
-
100
-
101
-
102
-
103
-
104
-
105
-
106
-
107
-
108
-
109
-
110
-
111
-
112
-
113
-
114
-
115
-
116
-
117
-
118
-
119
-
120
-
121
-
122
-
123
-
124
-
125
-
126
-
127
-
128
-
129
-
130
-
131
-
132
-
133
-
134
-
135
-
136
-
137
-
138
-
139
-
140
-
141
-
142
-
143
-
144
-
145
-
146
-
147
-
148
-
149
-
150
-
151
-
152
-
153
-
154
-
155
-
156
-
157
-
158
-
 159
159 -
 160
160 -
 161
161 -
 162
162 -
 163
163 -
 164
164 -
 165
165 -
 166
166 -
 167
167 -
 168
168 -
 169
169 -
 170
170 -
 171
171 -
 172
172 -
 173
173 -
 174
174 -
 175
175 -
 176
176 -
 177
177 -
 178
178 -
 179
179 -
180
 |
 |

BlackBerry Limited
Management’s Discussion and Analysis of Financial Condition and Results of Operations
39
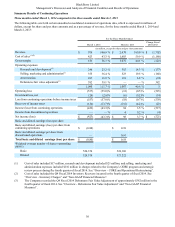
Financial Condition
Liquidity and Capital Resources
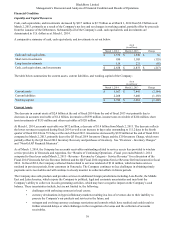
Cash, cash equivalents, and investments decreased by $217 million to $2.7 billion as at March 1, 2014 from $2.9 billion as at
March 2, 2013, primarily as a result of the Company's net loss and net changes in working capital, partially offset by proceeds
from the issuance of the Debentures. Substantially all of the Company’s cash, cash equivalents, and investments are
denominated in U.S. dollars as at March 1, 2014.
A comparative summary of cash, cash equivalents, and investments is set out below:
As at
(in millions)
March 1, 2014 March 2, 2013 Change
Cash and cash equivalents $ 1,579 $ 1,549 $ 30
Short-term investments 950 1,105 (155)
Long-term investments 129 221 (92)
Cash, cash equivalents, and investments $ 2,658 $ 2,875 $ (217)
The table below summarizes the current assets, current liabilities, and working capital of the Company:
As at
(in millions)
March 1, 2014 March 2, 2013 Change
Current assets $ 5,057 $ 7,441 (2,384)
Current liabilities 2,268 3,460 (1,192)
Working capital $ 2,789 $ 3,981 (1,192)
Current Assets
The decrease in current assets of $2.4 billion at the end of fiscal 2014 from the end of fiscal 2013 was primarily due to
decreases in accounts receivable of $1.4 billion, inventories of $359 million, income taxes receivable of $224 million, short
term investments of $155 million and other receivables of $120 million.
At March 1, 2014, accounts receivable was $972 million, a decrease of $1.4 billion from March 2, 2013. The decrease reflects
the lower revenues recognized during fiscal 2014 as well as an increase in days sales outstanding to 111.2 days in the fourth
quarter of fiscal 2014 from 79.9 days at the end of fiscal 2013. Inventories decreased by $359 million at the end of fiscal 2014
compared to March 2, 2013, primarily due to the Q3 Fiscal 2014 Inventory Charge and the Z10 Inventory Charge, which were
partially offset by the Q4 Fiscal 2014 Inventory Recovery and purchases of inventory. See “Overview - Inventory Charges”
and “Non-GAAP Financial Measures”.
As of March 1, 2014, the Company has accounts receivables outstanding related to service access fees provided to wireless
service providers in Venezuela and Argentina. See “Results of Continuing Operations - Fiscal year ended March 1, 2014
compared to fiscal year ended March 2, 2013 - Revenue - Revenue by Category - Service Revenue” for a discussion of the
Fiscal 2014 Venezuela Service Revenue Deferral and the Q4 Fiscal 2014 Argentina Service Revenue Deferral incurred in fiscal
2014. In fiscal 2014, the Company collected funds related to services rendered of $114 million, which includes services
rendered in previous periods, from customers in Venezuela. The Company continues to face challenges in obtaining timely
payments on its receivables and will continue to closely monitor its collection efforts in future periods.
The Company also sells products and provides services in additional foreign jurisdictions including Asia-Pacific, the Middle
East and Latin America, which expose the Company to political, legal and economic uncertainties and may limit the
Company’s ability to collect on its sales generating activities, which may have a negative impact on the Company’s cash
balance. These uncertainties include, but are not limited to, the following:
• challenges with enforcing contracts in local courts;
• currency devaluations in hyper-inflationary markets resulting in a loss of revenues due to their inability to
procure the Company’s our products and services in the future; and
• stringent and evolving currency exchange restrictions and controls which have resulted and could result in
further extended delays or other challenges in the recognition of revenue and the collection of accounts
receivables.