Blackberry 2014 Annual Report Download - page 106
Download and view the complete annual report
Please find page 106 of the 2014 Blackberry annual report below. You can navigate through the pages in the report by either clicking on the pages listed below, or by using the keyword search tool below to find specific information within the annual report.-
 1
1 -
2
-
3
-
4
-
5
-
6
-
7
-
8
-
9
-
10
-
11
-
12
-
13
-
14
-
15
-
16
-
17
-
18
-
19
-
20
-
21
-
22
-
23
-
24
-
25
-
26
-
27
-
28
-
29
-
30
-
31
-
32
-
33
-
34
-
35
-
36
-
37
-
38
-
39
-
40
-
41
-
42
-
43
-
44
-
45
-
46
-
47
-
48
-
49
-
50
-
51
-
52
-
53
-
54
-
55
-
56
-
57
-
58
-
59
-
60
-
61
-
62
-
63
-
64
-
65
-
66
-
67
-
68
-
69
-
70
-
71
-
72
-
73
-
74
-
75
-
76
-
77
-
78
-
79
-
80
-
81
-
82
-
83
-
84
-
85
-
86
-
87
-
88
-
89
-
90
-
91
-
92
-
93
-
94
-
95
-
 96
96 -
 97
97 -
 98
98 -
 99
99 -
 100
100 -
 101
101 -
 102
102 -
 103
103 -
 104
104 -
 105
105 -
 106
106 -
 107
107 -
 108
108 -
 109
109 -
 110
110 -
 111
111 -
 112
112 -
 113
113 -
 114
114 -
 115
115 -
 116
116 -
117
-
118
-
119
-
120
-
121
-
122
-
123
-
124
-
125
-
126
-
127
-
128
-
129
-
130
-
131
-
132
-
133
-
134
-
135
-
136
-
137
-
138
-
139
-
140
-
141
-
142
-
143
-
144
-
145
-
146
-
147
-
148
-
149
-
150
-
151
-
152
-
153
-
154
-
155
-
156
-
157
-
158
-
159
-
160
-
161
-
162
-
163
-
164
-
165
-
166
-
167
-
168
-
169
-
170
-
171
-
172
-
173
-
174
-
175
-
176
-
177
-
178
-
179
-
180
 |
 |

BlackBerry Limited
Notes to the Consolidated Financial Statements
In millions of United States dollars, except share and per share data, and except as otherwise indicated
17
presented the impaired assets at their fair values on the Company’s balance sheets as at November 30, 2013. See Note 1
for details related to the LLA impairment test performed.
The fair values of the Company’s real estate assets were determined using market appraisals conducted by certified
appraisers.
The fair values of the Company’s property, plant and equipment, other than real estate assets ("Personal Property"), were
determined using replacement cost or sales comparison approaches with inputs including, but not limited to, original
costs, inflation indices, useful lives, effective ages, and market-derived depreciation curves for similar assets. Some of
these inputs are unobservable.
The fair value of certain of the Company’s licenses, representing payments relating to licensing agreements, were
determined using a volume ratio approach, including a comparison of the Company’s current average quarterly unit
volumes for each license to those known at the time the Company entered into the license. Some of the inputs are
unobservable.
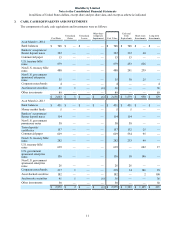
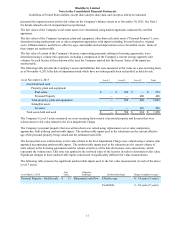
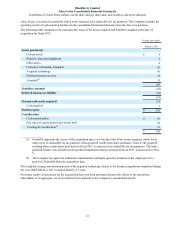
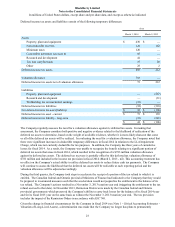
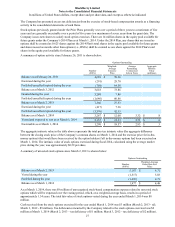
The following table presents the Company’s assets and liabilities that were measured at fair value on a non-recurring basis
as at November 4, 2013 (the date of impairment) and which have not subsequently been reclassified as held for sale:
As at November 4, 2013 Level 1 Level 2 Level 3 Total
Assets held and used
Property, plant and equipment
Real estate $ — $ 594 $ — $ 594
Personal Property — — 408 408
Total property, plant and equipment — 594 408 1,002
Intangible assets
Licenses — — 226 226
Total assets held and used $ — $ 594 $ 634 $ 1,228
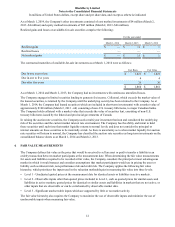
The Company’s Level 3 assets measured on a non-recurring basis consist of personal property and licenses that were
written down to fair value related to the LLA Impairment Charge.
The Company’s personal property that was written down was valued using replacement cost or sales comparison
approaches, both utilizing unobservable inputs. The unobservable inputs used in the valuations are the current effective
age of the personal property being valued and the estimated useful life.
The licenses that were written down to fair value related to the LLA Impairment Charge were valued using a volume ratio
approach incorporating unobservable inputs. The unobservable inputs used in the valuation are the current volume of
units subject to the licensing agreements and the volume of units as of the date the licenses were entered into, which
represents the volume ratio. This ratio was applied to the net book value of the licenses in order to determine its fair value.
Significant changes in these unobservable inputs could result in significantly different fair value measurements.
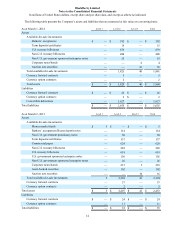
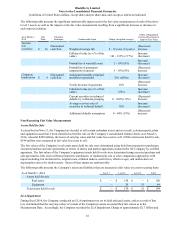
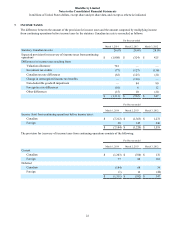
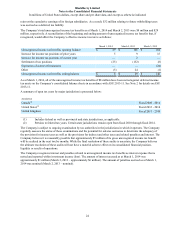
The following table presents the significant unobservable inputs used in the fair value measurement of each of the above
Level 3 assets:
As at March 1, 2014 Fair
Value Valuation
Technique Unobservable Input Range (weighted average)
Personal Property - held for sale $ 15 Discounted cash flow Effective age 0 - 14 years (3 years)
Useful life 2 - 10 years (5 years)