Blackberry 2014 Annual Report Download - page 157
Download and view the complete annual report
Please find page 157 of the 2014 Blackberry annual report below. You can navigate through the pages in the report by either clicking on the pages listed below, or by using the keyword search tool below to find specific information within the annual report.-
 1
1 -
2
-
3
-
4
-
5
-
6
-
7
-
8
-
9
-
10
-
11
-
12
-
13
-
14
-
15
-
16
-
17
-
18
-
19
-
20
-
21
-
22
-
23
-
24
-
25
-
26
-
27
-
28
-
29
-
30
-
31
-
32
-
33
-
34
-
35
-
36
-
37
-
38
-
39
-
40
-
41
-
42
-
43
-
44
-
45
-
46
-
47
-
48
-
49
-
50
-
51
-
52
-
53
-
54
-
55
-
56
-
57
-
58
-
59
-
60
-
61
-
62
-
63
-
64
-
65
-
66
-
67
-
68
-
69
-
70
-
71
-
72
-
73
-
74
-
75
-
76
-
77
-
78
-
79
-
80
-
81
-
82
-
83
-
84
-
85
-
86
-
87
-
88
-
89
-
90
-
91
-
92
-
93
-
94
-
95
-
96
-
97
-
98
-
99
-
100
-
101
-
102
-
103
-
104
-
105
-
106
-
107
-
108
-
109
-
110
-
111
-
112
-
113
-
114
-
115
-
116
-
117
-
118
-
119
-
120
-
121
-
122
-
123
-
124
-
125
-
126
-
127
-
128
-
129
-
130
-
131
-
132
-
133
-
134
-
135
-
136
-
137
-
138
-
139
-
140
-
141
-
142
-
143
-
144
-
145
-
146
-
 147
147 -
 148
148 -
 149
149 -
 150
150 -
 151
151 -
 152
152 -
 153
153 -
 154
154 -
 155
155 -
 156
156 -
 157
157 -
 158
158 -
 159
159 -
 160
160 -
 161
161 -
 162
162 -
 163
163 -
 164
164 -
 165
165 -
 166
166 -
 167
167 -
168
-
169
-
170
-
171
-
172
-
173
-
174
-
175
-
176
-
177
-
178
-
179
-
180
 |
 |

BlackBerry Limited
Management’s Discussion and Analysis of Financial Condition and Results of Operations
27
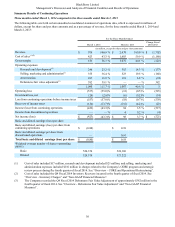
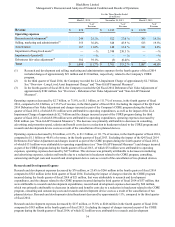
Charge and charges incurred as part of the Company’s previous cost optimization program during fiscal 2012, of which $111
million were attributed to operating expenditures, operating expenses decreased by $402 million. This decrease was primarily
attributable to decreased marketing costs, an increase in foreign exchange gains and cost savings related to vendor contracts
and a net reduction in headcount related costs driven by the CORE program compared to fiscal 2012.
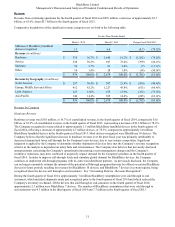
Research and Development Expenses
Research and development expenses consist primarily of salaries and benefits for technical personnel, new product
development costs, travel, office and building infrastructure costs and other employee costs.
Research and development expenses decreased by $47 million, or 3.0%, to $1.5 billion in fiscal 2013, compared to $1.6 billion
in fiscal 2012. Excluding the impact of charges incurred as part of the CORE program during fiscal 2013, of which $27 million
were attributable to research and development expenditures, and the charges incurred as part of the Company’s previous cost
optimization program during fiscal 2012, of which $23 million were attributed to research and development expenditures,
research and development expenses decreased by $51 million. This decrease was primarily attributable to a reduction in
materials costs due to fewer new product introductions as well as a net reduction in headcount related costs driven by the
CORE program compared to fiscal 2012. Research and development related headcount decreased by approximately 9%,
compared to fiscal 2012.
Selling, Marketing and Administration Expenses
Selling, marketing and administration expenses consist primarily of marketing, advertising and promotion, salaries and
benefits, external advisory fees, information technology costs, office and related staffing infrastructure costs and travel
expenses.
Selling, marketing and administration expenses decreased by $489 million, or 18.8%, to $2.1 billion in fiscal 2013 compared to
$2.6 billion in fiscal 2012. Excluding the impact of charges incurred as part of the CORE program during fiscal 2013, of which
$97 million was attributable to selling, marketing and administration expenditures, and the charges incurred as part of the
Company’s previous cost optimization program during fiscal 2012, of which $88 million was attributable to selling marketing
and administration expenditures, selling, marketing and administration expenses decreased by $498 million. This decrease was
primarily attributable to decreased marketing costs, an increase in foreign exchange gains and cost savings related to vendor
contracts and a net reduction in headcount related costs driven by the CORE program compared to fiscal 2012. Headcount
related to selling, marketing and administration functions decreased by approximately 33%, as compared to fiscal 2012.
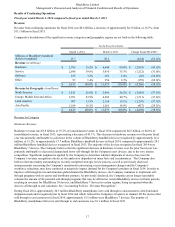
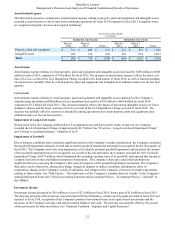
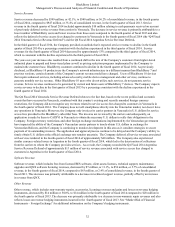
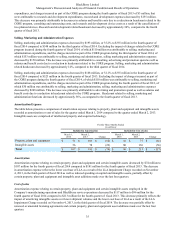
Amortization Expense
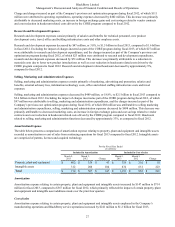
The table below presents a comparison of amortization expense relating to property, plant and equipment and intangible assets
recorded as amortization or cost of sales from continuing operations for fiscal 2013 compared to fiscal 2012. Intangible assets
are comprised of patents, licenses and acquired technology.
For the Fiscal Year Ended
(in millions)
Included in Amortization Included in Cost of sales
March 2,
2013 March 3,
2012 Change March 2,
2013 March 3,
2012 Change
Property, plant and equipment $ 402 $ 359 $ 43 $ 319 $ 301 $ 18
Intangible assets 312 208 104 874 651 223
Total $ 714 $ 567 $ 147 $ 1,193 $ 952 $ 241
Amortization
Amortization expense relating to certain property, plant and equipment and intangible assets increased by $147 million to $714
million for fiscal 2013, compared to $567 million for fiscal 2012, which primarily reflected the impact of certain property, plant
and equipment and intangible asset additions made over the prior four quarters.
Cost of sales
Amortization expense relating to certain property, plant and equipment and intangible assets employed in the Company’s
manufacturing operations and BlackBerry service operations increased by $241 million to $1.2 billion for fiscal 2013,