Blackberry 2014 Annual Report Download - page 117
Download and view the complete annual report
Please find page 117 of the 2014 Blackberry annual report below. You can navigate through the pages in the report by either clicking on the pages listed below, or by using the keyword search tool below to find specific information within the annual report.-
 1
1 -
2
-
3
-
4
-
5
-
6
-
7
-
8
-
9
-
10
-
11
-
12
-
13
-
14
-
15
-
16
-
17
-
18
-
19
-
20
-
21
-
22
-
23
-
24
-
25
-
26
-
27
-
28
-
29
-
30
-
31
-
32
-
33
-
34
-
35
-
36
-
37
-
38
-
39
-
40
-
41
-
42
-
43
-
44
-
45
-
46
-
47
-
48
-
49
-
50
-
51
-
52
-
53
-
54
-
55
-
56
-
57
-
58
-
59
-
60
-
61
-
62
-
63
-
64
-
65
-
66
-
67
-
68
-
69
-
70
-
71
-
72
-
73
-
74
-
75
-
76
-
77
-
78
-
79
-
80
-
81
-
82
-
83
-
84
-
85
-
86
-
87
-
88
-
89
-
90
-
91
-
92
-
93
-
94
-
95
-
96
-
97
-
98
-
99
-
100
-
101
-
102
-
103
-
104
-
105
-
106
-
 107
107 -
 108
108 -
 109
109 -
 110
110 -
 111
111 -
 112
112 -
 113
113 -
 114
114 -
 115
115 -
 116
116 -
 117
117 -
 118
118 -
 119
119 -
 120
120 -
 121
121 -
 122
122 -
 123
123 -
 124
124 -
 125
125 -
 126
126 -
 127
127 -
128
-
129
-
130
-
131
-
132
-
133
-
134
-
135
-
136
-
137
-
138
-
139
-
140
-
141
-
142
-
143
-
144
-
145
-
146
-
147
-
148
-
149
-
150
-
151
-
152
-
153
-
154
-
155
-
156
-
157
-
158
-
159
-
160
-
161
-
162
-
163
-
164
-
165
-
166
-
167
-
168
-
169
-
170
-
171
-
172
-
173
-
174
-
175
-
176
-
177
-
178
-
179
-
180
 |
 |
BlackBerry Limited
Notes to the Consolidated Financial Statements
In millions of United States dollars, except share and per share data, and except as otherwise indicated
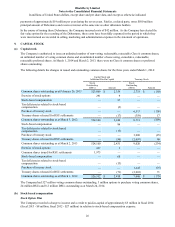
28
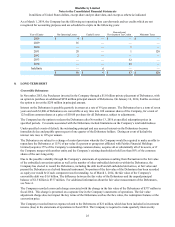
During the year ended March 1, 2014, there were no stock options granted (March 2, 2013 - 5,288,040; March 3, 2012 -
there were no stock options granted).
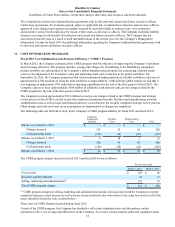
Restricted Share Unit Plan
The Company recorded compensation expense with respect to RSUs of approximately $63 million in the year ended
March 1, 2014 (March 2, 2013 -$78 million; March 3, 2012 -$70 million).
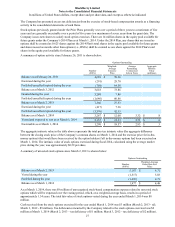
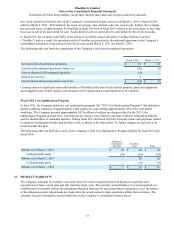
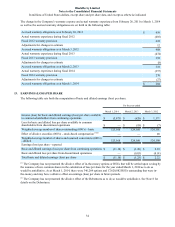
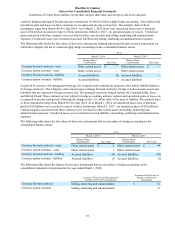
A summary of RSU activity since February 26, 2011 is shown below:
RSUs Outstanding
Number
(000’s)
Weighted-
Average
Grant Date
Fair Value
Average
Remaining
Contractual
Life in Years
Aggregate
Intrinsic
Value
(millions)
Balance as at February 26, 2011 2,703 $ 57.40
Granted during the year 7,093 25.33
Vested during the year (359) 60.42
Forfeited/cancelled during the year (842) 45.73
Balance as at March 3, 2012 8,595 31.96
Granted during the year 11,189 7.94
Vested during the year (2,697) 38.96
Forfeited/cancelled during the year (1,902) 25.46
Balance as at March 2, 2013 15,185 13.83
Granted during the year 21,741 7.39
Vested during the year (4,977) 17.11
Forfeited/cancelled during the year (7,604) 11.44
Balance as at March 1, 2014 24,345 $ 8.15 2.86 $ 244
Vested and expected to vest March 1, 2014 23,736 $ 8.11 2.89 $ 237
The aggregate intrinsic value in the table above represents the total pre-tax intrinsic value (the aggregate closing share
price of the Company’s common shares on March 1, 2014) that would have been received by RSU holders if all RSUs had
been vested on March 1, 2014.
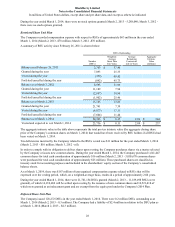
Tax deficiencies incurred by the Company related to the RSUs vested was $11 million for the year ended March 1, 2014
(March 2, 2013 - $10 million; March 3, 2012 - nil).
In order to comply with its obligation to deliver shares upon vesting, the Company purchases shares via a trustee selected
by the Company or issues new common shares. During the year ended March 1, 2014, the Company purchased 1,641,447
common shares for total cash consideration of approximately $16 million (March 2, 2013 - 3,005,670 common shares
were purchased for total cash consideration of approximately $25 million). These purchased shares are classified as
treasury stock for accounting purposes and included in the shareholders’ equity section of the Company’s consolidated
balance sheets.
As at March 1, 2014, there was $167 million of unrecognized compensation expense related to RSUs that will be
expensed over the vesting period, which, on a weighted-average basis, results in a period of approximately 2.04 years.
During the year ended March 1, 2014, there were 21,741,154 RSUs granted (March 2, 2013 – 11,189,498 RSUs were
granted), of which 16,210,460 will be settled upon vesting by the issuance of new common shares and 10,521,418 of
which were granted as an inducement grant and are exempt from the equity pool under the Company's 2014 Plan.
Deferred Share Unit Plan
The Company issued 128,272 DSUs in the year ended March 1, 2014. There were 0.2 million DSUs outstanding as at
March 1, 2014 (March 2, 2013 - 0.3 million). The Company had a liability of $2.4 million in relation to the DSU plan as
at March 1, 2014 (March 2, 2013 - $4.3 million).