Blackberry 2014 Annual Report Download - page 116
Download and view the complete annual report
Please find page 116 of the 2014 Blackberry annual report below. You can navigate through the pages in the report by either clicking on the pages listed below, or by using the keyword search tool below to find specific information within the annual report.-
 1
1 -
2
-
3
-
4
-
5
-
6
-
7
-
8
-
9
-
10
-
11
-
12
-
13
-
14
-
15
-
16
-
17
-
18
-
19
-
20
-
21
-
22
-
23
-
24
-
25
-
26
-
27
-
28
-
29
-
30
-
31
-
32
-
33
-
34
-
35
-
36
-
37
-
38
-
39
-
40
-
41
-
42
-
43
-
44
-
45
-
46
-
47
-
48
-
49
-
50
-
51
-
52
-
53
-
54
-
55
-
56
-
57
-
58
-
59
-
60
-
61
-
62
-
63
-
64
-
65
-
66
-
67
-
68
-
69
-
70
-
71
-
72
-
73
-
74
-
75
-
76
-
77
-
78
-
79
-
80
-
81
-
82
-
83
-
84
-
85
-
86
-
87
-
88
-
89
-
90
-
91
-
92
-
93
-
94
-
95
-
96
-
97
-
98
-
99
-
100
-
101
-
102
-
103
-
104
-
105
-
 106
106 -
 107
107 -
 108
108 -
 109
109 -
 110
110 -
 111
111 -
 112
112 -
 113
113 -
 114
114 -
 115
115 -
 116
116 -
 117
117 -
 118
118 -
 119
119 -
 120
120 -
 121
121 -
 122
122 -
 123
123 -
 124
124 -
 125
125 -
 126
126 -
127
-
128
-
129
-
130
-
131
-
132
-
133
-
134
-
135
-
136
-
137
-
138
-
139
-
140
-
141
-
142
-
143
-
144
-
145
-
146
-
147
-
148
-
149
-
150
-
151
-
152
-
153
-
154
-
155
-
156
-
157
-
158
-
159
-
160
-
161
-
162
-
163
-
164
-
165
-
166
-
167
-
168
-
169
-
170
-
171
-
172
-
173
-
174
-
175
-
176
-
177
-
178
-
179
-
180
 |
 |

BlackBerry Limited
Notes to the Consolidated Financial Statements
In millions of United States dollars, except share and per share data, and except as otherwise indicated
27
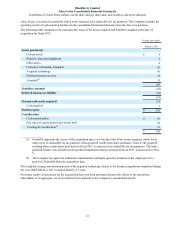
The Company has presented excess tax deficiencies from the exercise of stock-based compensation awards as a financing
activity in the consolidated statements of cash flows.
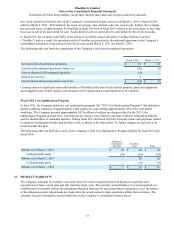
Stock options previously granted under the Prior Plans generally vest over a period of three years to a maximum of five
years and are generally exercisable over a period of five years to a maximum of seven years from the grant date. The
Company issues new shares to satisfy stock option exercises. There are 14 million shares in the equity pool available for
future grants under the Company’s 2014 Plan as at March 1, 2014. Under the 2014 Plan, any shares that are issued as
options shall be counted as 0.625 shares against the 2014 Plan's total shares in the equity pool available for future grants
and shares issued as awards other than options (i.e., RSUs) shall be counted as one share against the 2014 Plan's total
shares in the equity pool available for future grants.
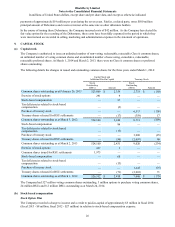
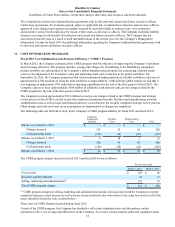
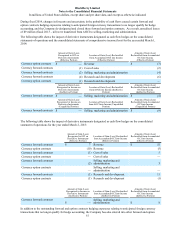
A summary of option activity since February 26, 2011 is shown below:
Options Outstanding
Number
(000’s)
Weighted-
Average
Exercise
Price
Average
Remaining
Contractual
Life in Years
Aggregate
Intrinsic
Value
(millions)
Balance as at February 26, 2011 4,610 $ 70.36
Exercised during the year (291) 29.70
Forfeited/cancelled/expired during the year (701) 64.58
Balance as at March 3, 2012 3,618 73.86
Granted during the year 5,288 7.86
Forfeited/cancelled/expired during the year (1,646) 60.86
Balance as at March 2, 2013 7,260 27.53
Exercised during the year (417) 7.36
Forfeited/cancelled/expired during the year (3,576) 42.55
Balance as at March 1, 2014 3,267 $ 12.08 3.32 $ 8
Vested and expected to vest as at March 1, 2014 3,153 $ 12.23 3.31 $ 6
Exercisable as at March 1, 2014 1,290 $ 18.57 2.93 $ 3
The aggregate intrinsic value in the table above represents the total pre-tax intrinsic value (the aggregate difference
between the closing stock price of the Company’s common shares on March 1, 2014 and the exercise price for in-the-
money options) that would have been received by the option holders if all in-the-money options had been exercised on
March 1, 2014. The intrinsic value of stock options exercised during fiscal 2014, calculated using the average market
price during the year, was approximately $0.59 per share.
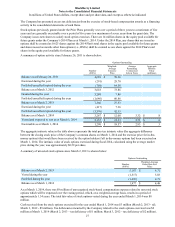
A summary of unvested stock options since March 2, 2013 is shown below:
Options Outstanding
Number
(000’s)
Weighted-Average
Grant Date Fair
Value
Balance as at March 2, 2013 5,187 $ 4.71
Vested during the year (1,517) 5.03
Forfeited during the year (1,693) 4.71
Balance as at March 1, 2014 1,977 $ 4.48
As at March 1, 2014, there was $9 million of unrecognized stock-based compensation expense related to unvested stock
options which will be expensed over the vesting period, which, on a weighted-average basis, results in a period of
approximately 1.34 years. The total fair value of stock options vested during the year ended March 1, 2014 was $8
million.
Cash received from the stock options exercised for the year ended March 1, 2014 was $3 million (March 2, 2013 - nil;
March 3, 2012 - $9 million). Tax deficiencies incurred by the Company related to the stock options exercised was $2
million at March 1, 2014 (March 2, 2013 – tax deficiency of $1 million; March 3, 2012 – tax deficiency of $2 million).