BP 2015 Annual Report Download - page 89
Download and view the complete annual report
Please find page 89 of the 2015 BP annual report below. You can navigate through the pages in the report by either clicking on the pages listed below, or by using the keyword search tool below to find specific information within the annual report.-
 1
1 -
2
-
3
-
4
-
5
-
6
-
7
-
8
-
9
-
10
-
11
-
12
-
13
-
14
-
15
-
16
-
17
-
18
-
19
-
20
-
21
-
22
-
23
-
24
-
25
-
26
-
27
-
28
-
29
-
30
-
31
-
32
-
33
-
34
-
35
-
36
-
37
-
38
-
39
-
40
-
41
-
42
-
43
-
44
-
45
-
46
-
47
-
48
-
49
-
50
-
51
-
52
-
53
-
54
-
55
-
56
-
57
-
58
-
59
-
60
-
61
-
62
-
63
-
64
-
65
-
66
-
67
-
68
-
69
-
70
-
71
-
72
-
73
-
74
-
75
-
76
-
77
-
78
-
 79
79 -
 80
80 -
 81
81 -
 82
82 -
 83
83 -
 84
84 -
 85
85 -
 86
86 -
 87
87 -
 88
88 -
 89
89 -
 90
90 -
 91
91 -
 92
92 -
 93
93 -
 94
94 -
 95
95 -
 96
96 -
 97
97 -
 98
98 -
 99
99 -
100
-
101
-
102
-
103
-
104
-
105
-
106
-
107
-
108
-
109
-
110
-
111
-
112
-
113
-
114
-
115
-
116
-
117
-
118
-
119
-
120
-
121
-
122
-
123
-
124
-
125
-
126
-
127
-
128
-
129
-
130
-
131
-
132
-
133
-
134
-
135
-
136
-
137
-
138
-
139
-
140
-
141
-
142
-
143
-
144
-
145
-
146
-
147
-
148
-
149
-
150
-
151
-
152
-
153
-
154
-
155
-
156
-
157
-
158
-
159
-
160
-
161
-
162
-
163
-
164
-
165
-
166
-
167
-
168
-
169
-
170
-
171
-
172
-
173
-
174
-
175
-
176
-
177
-
178
-
179
-
180
-
181
-
182
-
183
-
184
-
185
-
186
-
187
-
188
-
189
-
190
-
191
-
192
-
193
-
194
-
195
-
196
-
197
-
198
-
199
-
200
-
201
-
202
-
203
-
204
-
205
-
206
-
207
-
208
-
209
-
210
-
211
-
212
-
213
-
214
-
215
-
216
-
217
-
218
-
219
-
220
-
221
-
222
-
223
-
224
-
225
-
226
-
227
-
228
-
229
-
230
-
231
-
232
-
233
-
234
-
235
-
236
-
237
-
238
-
239
-
240
-
241
-
242
-
243
-
244
-
245
-
246
-
247
-
248
-
249
-
250
-
251
-
252
-
253
-
254
-
255
-
256
-
257
-
258
-
259
-
260
-
261
-
262
-
263
-
264
-
265
-
266
 |
 |

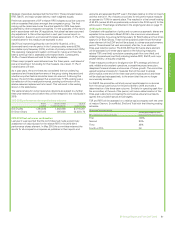
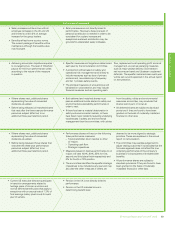
Corporate governance
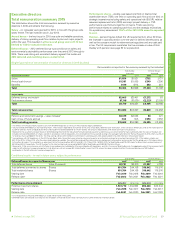
Directors’ shareholdings
Executive directors are required to develop a personal shareholding of five
times salary within a reasonable period of time from appointment. It is the
stated intention of the policy that executive directors build this level of
personal shareholding primarily by retaining those shares that vest in the
deferred bonus and performance share plans which are part of the EDIP.
In assessing whether the requirement has been met, the committee takes
account of the factors it considers appropriate, including promotions and
vesting levels of these share plans, as well as any abnormal share price
fluctuations. The table below shows the status of each of the executive
directors in developing this level. These figures include the value as at
22 February 2016 from the directors’ interests shown below plus the
assumed vesting of the 2013-2015 performance shares and is consistent
with the figures reported in the single figure table on page 77.
Appointment date
Value of current
shareholding
% of policy
achieved
Bob Dudley October 2010 $12,478,540 135
Dr Brian Gilvary January 2012 £3,559,733 97
The committee is satisfied that all executive directors’ shareholdings meet
the policy requirement.
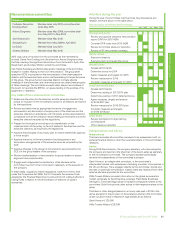
The figures below indicate and include all beneficial and non-beneficial
interests of each executive director of the company in shares of BP (or
calculated equivalents) that have been disclosed to the company under the
Disclosure and Transparency Rules (DTRs) as at the applicable dates.
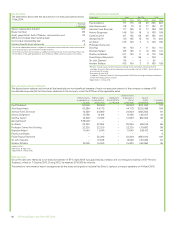
Current directors
Ordinary
shares or
equivalents at
1 Jan 2015
Ordinary
shares or
equivalents at
31 Dec 2015
Change from
31 Dec 2015
to
22 Feb 2016
Ordinary
shares or
equivalents
total at
22 Feb 2016
Bob Dudleya738,858 1,554,198 285,366 1,839,564
Dr Brian Gilvary 545,217 903,856 201,710 1,105,566
a Held as ADSs.
The following table shows both the performance shares and the deferred
bonus element awarded under the EDIP. These figures represent the
maximum possible vesting levels. The actual number of shares/ADSs that
vest will depend on the extent to which performance conditions have been
satisfied over a three-year period.
Current directors
Performance
shares at
1 Jan 2015
Performance
shares at
31 Dec 2015
Change from
31 Dec 2015 to
22 Feb 2016
Performance
shares total at
22 Feb 2016
Bob Dudleya5,227,500 5,536,950 (458,760)5,078,19 0
Dr Brian Gilvary 2,375,957 2,789,921 (315,260) 2,474,661
a Held as ADSs.
At 22 February 2016, the following directors held the numbers of options
under the BP group share option schemes over ordinary shares or their
calculated equivalent set out below. None of these are subject to
performance conditions. Additional details regarding these options can be
found on page 87.
Current director Options
Dr Brian Gilvary 504,191
No director has any interest in the preference shares or debentures of the
company or in the shares or loan stock of any subsidiary company.
There are no directors or other members of senior management who own
more than 1% of the ordinary shares in issue. At 22 February 2016, all
directors and other members of senior management as a group held
interests of 17,529,149 ordinary shares or their calculated equivalent,
8,761,779 performance shares or their calculated equivalent and 6,039,841
options over ordinary shares or their calculated equivalent under the BP
group share option schemes. Senior management comprises members of
the executive team. See pages 60-61 for further information.
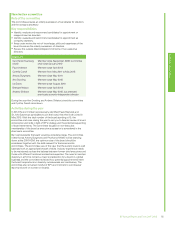
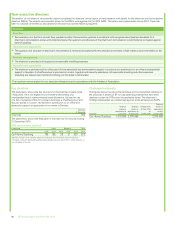
History of CEO remuneration
Year CEO
Total
remuneration
thousanda
Annual bonus
% of
maximum
Performance
share vesting
% of maximum
2009 Hayward £6,753 89b17.5
2010cHayward £3,890 0 0
Dudley $8,057 0 0
2011 Dudley $8,43967 16.7
2012 Dudley $9,609 65 0
2013 Dudley $15,086 88 45.5
2014 Dudley $16,390 73 63.8
2015 Dudley $19,602 100 77.6
a Total remuneration figures include pension. For Bob Dudley this has been restated since 2010 in
accordance with the principles explained on page 82, to include the value of the company’s
contribution to his US retirement savings arrangements. The total figure is also affected by share
vesting outcomes and these numbers represent the actual outcome for the periods up to 2011 or
the adjusted outcome in subsequent years where a preliminary assessment of the performance
for EDIP was made. For 2015, the preliminary assessment has been reflected.
b 2009 annual bonus did not have an absolute maximum and so is shown as a percentage of the
maximum established in 2010.
c 2010 figures show full year total remuneration for both Tony Hayward and Bob Dudley, although
Bob Dudley did not become CEO until October 2010.
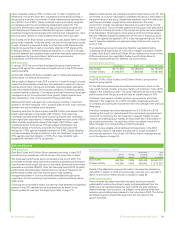
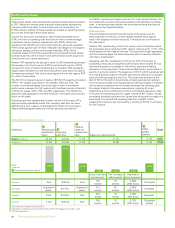
Relative importance of spend on pay (million)
Distributions to
shareholders
Remuneration paid to
all employeesa
Capital investmentb
2015 2014 2015 2014 2015 2014
Total 38.8% decrease 7.2% decrease 18.1% decrease
Dividends 1.9%
increase
No buybacks
in 2015
a Total remuneration reflects overall employee costs. See Financial statements – Note 34 for further
information.
b Capital investment reflects organic capital expenditure★.
c See Financial statements – Note 30 for further information.
d Dividends includes both scrip dividends as well as those paid in cash. See Financial statements –
Note 9 for further information.
$12,928 $13,936
$22,892
$18,748
Buybacksc
$4,770
Dividendsd
$7,168
$7,301
$11,938
Dividendsd
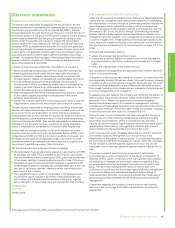
Percentage change in CEO remuneration
Comparing 2015 to 2014 Salary Benefits Bonus
% change in CEO remuneration 1.5%4.4%38.4%
% change in comparator group remuneration 0%a0%b27.9%
a The comparator group comprises some 31% of BP’s global employee population being
professional/managerial grades of employees based in the UK and US and employed on more
readily comparable terms.
b There was no change in employee benefits level.
Defined on page 256.BP Annual Report and Form 20-F 2015 85