BP 2015 Annual Report Download - page 150
Download and view the complete annual report
Please find page 150 of the 2015 BP annual report below. You can navigate through the pages in the report by either clicking on the pages listed below, or by using the keyword search tool below to find specific information within the annual report.-
 1
1 -
2
-
3
-
4
-
5
-
6
-
7
-
8
-
9
-
10
-
11
-
12
-
13
-
14
-
15
-
16
-
17
-
18
-
19
-
20
-
21
-
22
-
23
-
24
-
25
-
26
-
27
-
28
-
29
-
30
-
31
-
32
-
33
-
34
-
35
-
36
-
37
-
38
-
39
-
40
-
41
-
42
-
43
-
44
-
45
-
46
-
47
-
48
-
49
-
50
-
51
-
52
-
53
-
54
-
55
-
56
-
57
-
58
-
59
-
60
-
61
-
62
-
63
-
64
-
65
-
66
-
67
-
68
-
69
-
70
-
71
-
72
-
73
-
74
-
75
-
76
-
77
-
78
-
79
-
80
-
81
-
82
-
83
-
84
-
85
-
86
-
87
-
88
-
89
-
90
-
91
-
92
-
93
-
94
-
95
-
96
-
97
-
98
-
99
-
100
-
101
-
102
-
103
-
104
-
105
-
106
-
107
-
108
-
109
-
110
-
111
-
112
-
113
-
114
-
115
-
116
-
117
-
118
-
119
-
120
-
121
-
122
-
123
-
124
-
125
-
126
-
127
-
128
-
129
-
130
-
131
-
132
-
133
-
134
-
135
-
136
-
137
-
138
-
139
-
 140
140 -
 141
141 -
 142
142 -
 143
143 -
 144
144 -
 145
145 -
 146
146 -
 147
147 -
 148
148 -
 149
149 -
 150
150 -
 151
151 -
 152
152 -
 153
153 -
 154
154 -
 155
155 -
 156
156 -
 157
157 -
 158
158 -
 159
159 -
 160
160 -
161
-
162
-
163
-
164
-
165
-
166
-
167
-
168
-
169
-
170
-
171
-
172
-
173
-
174
-
175
-
176
-
177
-
178
-
179
-
180
-
181
-
182
-
183
-
184
-
185
-
186
-
187
-
188
-
189
-
190
-
191
-
192
-
193
-
194
-
195
-
196
-
197
-
198
-
199
-
200
-
201
-
202
-
203
-
204
-
205
-
206
-
207
-
208
-
209
-
210
-
211
-
212
-
213
-
214
-
215
-
216
-
217
-
218
-
219
-
220
-
221
-
222
-
223
-
224
-
225
-
226
-
227
-
228
-
229
-
230
-
231
-
232
-
233
-
234
-
235
-
236
-
237
-
238
-
239
-
240
-
241
-
242
-
243
-
244
-
245
-
246
-
247
-
248
-
249
-
250
-
251
-
252
-
253
-
254
-
255
-
256
-
257
-
258
-
259
-
260
-
261
-
262
-
263
-
264
-
265
-
266
 |
 |

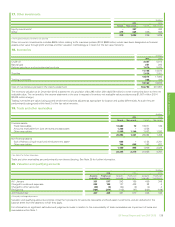
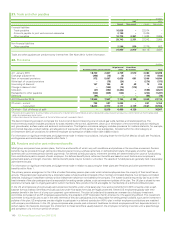
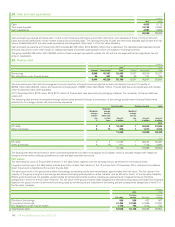
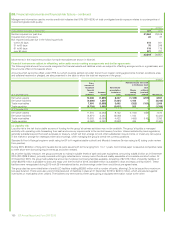
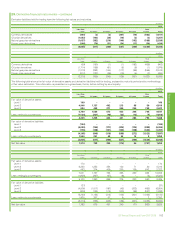
24. Cash and cash equivalents
$ million
2015 2014
Cash 4,653 5,112
Term bank deposits 16,749 18,392
Cash equivalents 4,987 6,259
26,389 29,763
Cash and cash equivalents comprise cash in hand; current balances with banks and similar institutions; term deposits of three months or less with
banks and similar institutions; money market funds and commercial paper. The carrying amounts of cash and term bank deposits approximate their fair
values. Substantially all of the other cash equivalents are categorized within level 1 of the fair value hierarchy.
Cash and cash equivalents at 31 December 2015 includes $2,439 million (2014 $2,264 million) that is restricted. The restricted cash balances include
amounts required to cover initial margin on trading exchanges and certain cash balances which are subject to exchange controls.
The group holds $4,329 million (2014 $3,852 million) of cash and cash equivalents outside the UK and it is not expected that any significant tax will
arise on repatriation.
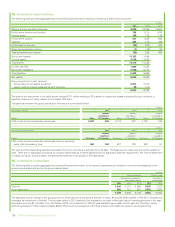
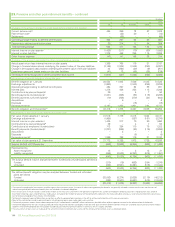
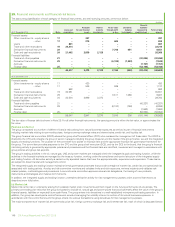
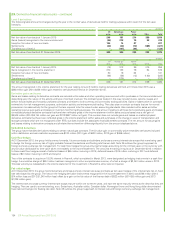
25. Finance debt
$ million
2015 2014
Current Non-current Total Current Non-current Total
Borrowings 6,898 45,567 52,465 6,831 45,240 52,071
Net obligations under finance leases 46 657 703 46 737 783
6,944 46,224 53,168 6,877 45,977 52,854
The main elements of current borrowings are the current portion of long-term borrowings that is due to be repaid in the next 12 months of
$5,942 million (2014 $6,343 million) and issued commercial paper of $869 million (2014 $444 million). Finance debt does not include accrued interest,
which is reported within other payables.
At 31 December 2015, $122 million (2014 $137 million) of finance debt was secured by the pledging of assets. The remainder of finance debt was
unsecured.
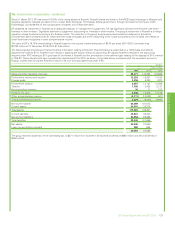
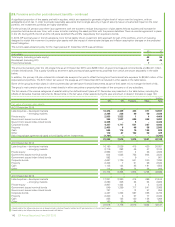
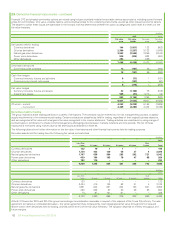
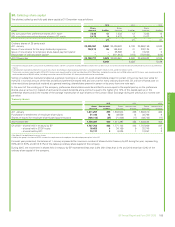
The following table shows the weighted average interest rates achieved through a combination of borrowings and derivative financial instruments
entered into to manage interest rate and currency exposures.
Fixed rate debt Floating rate debt Total
Weighted
average
interest
rate
%
Weighted
average
time for
which rate
is fixed
Years
Amount
$ million
Weighted
average
interest
rate
%
Amount
$ million
Amount
$ million
2015
US dollar 3 4 10,442 1 40,623 51,065
Other currencies 6 17 826 1 1,277 2,103
11,268 41,900 53,168
2014
US dollar 3 3 14,285 1 36,275 50,560
Other currencies 6 19 871 1 1,423 2,294
15,156 37,698 52,854
The floating rate debt denominated in other currencies represents euro debt not swapped to US dollars, which is naturally hedged with respect to
foreign currency risk by holding equivalent euro cash and cash equivalent amounts.
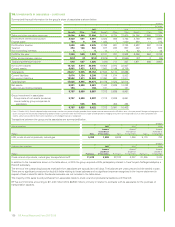
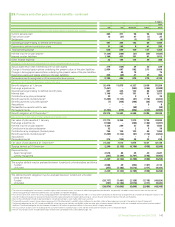
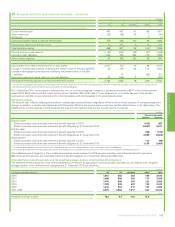
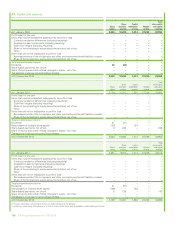
Fair values
The estimated fair value of finance debt is shown in the table below together with the carrying amount as reflected in the balance sheet.
Long-term borrowings in the table below include the portion of debt that matures in the 12 months from 31 December 2015, whereas in the balance
sheet the amount is reported within current finance debt.
The carrying amount of the group’s short-term borrowings, comprising mainly commercial paper, approximates their fair value. The fair values of the
majority of the group’s long-term borrowings are determined using quoted prices in active markets, and so fall within level 1 of the fair value hierarchy.
Where quoted prices are not available, quoted prices for similar instruments in active markets are used and such measurements are therefore
categorized in level 2 of the fair value hierarchy. The fair value of the group’s finance lease obligations is estimated using discounted cash flow analyses
based on the group’s current incremental borrowing rates for similar types and maturities of borrowing and are consequently categorized in level 2 of
the fair value hierarchy.
$ million
2015 2014
Fair value
Carrying
amount Fair value
Carrying
amount
Short-term borrowings 956 956 487 487
Long-term borrowings 51,404 51,509 51,995 51,584
Net obligations under finance leases 1,178 703 1,343 783
Total finance debt 53,538 53,168 53,825 52,854
146 BP Annual Report and Form 20-F 2015