BP 2015 Annual Report Download - page 22
Download and view the complete annual report
Please find page 22 of the 2015 BP annual report below. You can navigate through the pages in the report by either clicking on the pages listed below, or by using the keyword search tool below to find specific information within the annual report.-
 1
1 -
2
-
3
-
4
-
5
-
6
-
7
-
8
-
9
-
10
-
11
-
 12
12 -
 13
13 -
 14
14 -
 15
15 -
 16
16 -
 17
17 -
 18
18 -
 19
19 -
 20
20 -
 21
21 -
 22
22 -
 23
23 -
 24
24 -
 25
25 -
 26
26 -
 27
27 -
 28
28 -
 29
29 -
 30
30 -
 31
31 -
 32
32 -
33
-
34
-
35
-
36
-
37
-
38
-
39
-
40
-
41
-
42
-
43
-
44
-
45
-
46
-
47
-
48
-
49
-
50
-
51
-
52
-
53
-
54
-
55
-
56
-
57
-
58
-
59
-
60
-
61
-
62
-
63
-
64
-
65
-
66
-
67
-
68
-
69
-
70
-
71
-
72
-
73
-
74
-
75
-
76
-
77
-
78
-
79
-
80
-
81
-
82
-
83
-
84
-
85
-
86
-
87
-
88
-
89
-
90
-
91
-
92
-
93
-
94
-
95
-
96
-
97
-
98
-
99
-
100
-
101
-
102
-
103
-
104
-
105
-
106
-
107
-
108
-
109
-
110
-
111
-
112
-
113
-
114
-
115
-
116
-
117
-
118
-
119
-
120
-
121
-
122
-
123
-
124
-
125
-
126
-
127
-
128
-
129
-
130
-
131
-
132
-
133
-
134
-
135
-
136
-
137
-
138
-
139
-
140
-
141
-
142
-
143
-
144
-
145
-
146
-
147
-
148
-
149
-
150
-
151
-
152
-
153
-
154
-
155
-
156
-
157
-
158
-
159
-
160
-
161
-
162
-
163
-
164
-
165
-
166
-
167
-
168
-
169
-
170
-
171
-
172
-
173
-
174
-
175
-
176
-
177
-
178
-
179
-
180
-
181
-
182
-
183
-
184
-
185
-
186
-
187
-
188
-
189
-
190
-
191
-
192
-
193
-
194
-
195
-
196
-
197
-
198
-
199
-
200
-
201
-
202
-
203
-
204
-
205
-
206
-
207
-
208
-
209
-
210
-
211
-
212
-
213
-
214
-
215
-
216
-
217
-
218
-
219
-
220
-
221
-
222
-
223
-
224
-
225
-
226
-
227
-
228
-
229
-
230
-
231
-
232
-
233
-
234
-
235
-
236
-
237
-
238
-
239
-
240
-
241
-
242
-
243
-
244
-
245
-
246
-
247
-
248
-
249
-
250
-
251
-
252
-
253
-
254
-
255
-
256
-
257
-
258
-
259
-
260
-
261
-
262
-
263
-
264
-
265
-
266
 |
 |

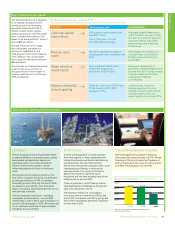
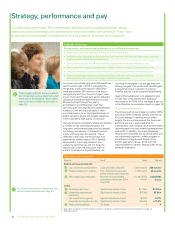
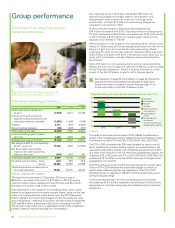
Integrated business
We benefit from having both upstream and
downstream businesses, as well as a well-
established oil and gas trading function that can
generate value for the group when prices are
volatile. A weak environment in one part of the
group can create opportunities in another. For
example, we delivered record profits in our
Downstream business in 2015.
Balanced portfolio
The geographical diversity and mix of resource
types in our portfolio can provide us with resilience
to a wide range of operating conditions and
opportunities for growth. In Upstream we operate
in countries with different commercial frameworks.
We have a significant part of our portfolio in
production-sharing agreements, where revenues
are typically less sensitive to oil price fluctuations.
Balance sheet flexibility
We maintain a strong balance sheet with
sufficient cash reserves, which helps to withstand
price falls and other events. We began 2015 with
significant cash reserves due to strong operating
cash flow in 2014 and the two divestment
programmes made since the Gulf of Mexico oil
spill. Most of these sales were made in the higher
oil price environment.
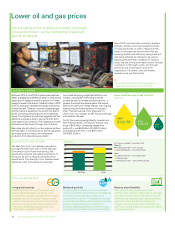
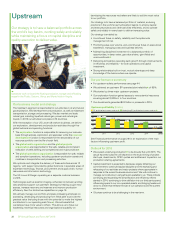
We are taking action to adapt to a lower oil and gas
price environment – while maintaining longer-term
growth prospects.
Lower oil and gas prices
Remodelling Mad Dog Phase 2 reduced our
project cost estimate by more than half.
Since 2010, we have been working to create a
stronger, simpler and more focused business.
This has positioned us well to respond to the
lower oil and gas price environment. We are
reducing capital expenditure by paring back and
rephasing activities as necessary, as well as
capturing the benefits of deflation of industry
costs. We are driving down cash costs★ through
a reduction in third-party costs, and through
efficiency and simplification across the
organization. As always, safe and reliable
operations are our first priority.
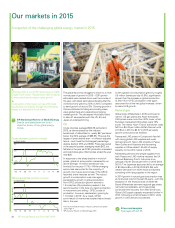
Between 2010 to mid-2014 oil prices were relatively
stable, averaging around $100 per barrel. In 2014, strong
supply growth, largely as a result of growth in US shale,
caused oil prices to fall sharply. Prices fell further in 2015
as OPEC production increased and supply continued to
outstrip demand. There are, however, increasing signs
that the market is adjusting to the current low level of
prices, with strong demand growth and weakening
supply. The high level of inventories suggests that this
adjustment process is likely to take some time, but it
does appear to be underway. This underpins our belief
that prices will stay lower for longer, but not forever.
Gas prices also fell, albeit on a more regional and less
dramatic scale. In markets such as the US, gas prices
are at historically low levels, with increases in
production from shale being a key factor.
The cash flow from our Upstream operations
was significantly lower than in 2014 although
Downstream cash flows were strong. We
significantly reduced the capital expenditure of
the group as well as received proceeds from
divestments. The strength of our balance sheet
helped us meet the balance of outgoings.
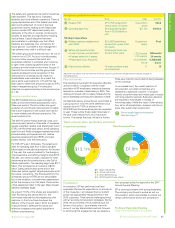
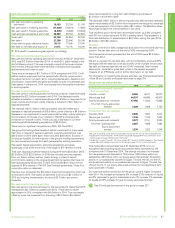
How we are resilient
Industry context
Sources and uses of cash
30
25
20
15
10
5
Operating cash flow − rest of group
Disposal proceeds − investing activities
Sources
Uses
Capital investment − investing activities
Dividends paid
Operating cash flow − Gulf of Mexico oil spill
($ billion) For the year ended 31 December 2015.
Sources Uses
$
Brent dated average crude oil prices
($/barrel)
2015
$52.39
2014
$98.95
2013
$108.66
Low prices are having a significant effect on our
industry, including BP. With falling revenues,
companies need to re-base costs and activity – a
process that could take several years. We expect
2016 to be a period of intense change, with ongoing
restructuring and further deflation in the supply
chain. That said, periods of low prices are not
uncommon in our industry and BP has gone through
such cycles in the past.
For BP, the lower prices significantly impacted our
2015 financial results. The result for the year was
a loss of $6.5 billion. Underlying replacement
cost profit★ was $5.9 billion (2014 $12.1 billion)
and operating cash flow★ was $19.1 billion
(2014 $32.8 billion).
BP Annual Report and Form 20-F 201518