BP 2015 Annual Report Download - page 108
Download and view the complete annual report
Please find page 108 of the 2015 BP annual report below. You can navigate through the pages in the report by either clicking on the pages listed below, or by using the keyword search tool below to find specific information within the annual report.-
 1
1 -
2
-
3
-
4
-
5
-
6
-
7
-
8
-
9
-
10
-
11
-
12
-
13
-
14
-
15
-
16
-
17
-
18
-
19
-
20
-
21
-
22
-
23
-
24
-
25
-
26
-
27
-
28
-
29
-
30
-
31
-
32
-
33
-
34
-
35
-
36
-
37
-
38
-
39
-
40
-
41
-
42
-
43
-
44
-
45
-
46
-
47
-
48
-
49
-
50
-
51
-
52
-
53
-
54
-
55
-
56
-
57
-
58
-
59
-
60
-
61
-
62
-
63
-
64
-
65
-
66
-
67
-
68
-
69
-
70
-
71
-
72
-
73
-
74
-
75
-
76
-
77
-
78
-
79
-
80
-
81
-
82
-
83
-
84
-
85
-
86
-
87
-
88
-
89
-
90
-
91
-
92
-
93
-
94
-
95
-
96
-
97
-
 98
98 -
 99
99 -
 100
100 -
 101
101 -
 102
102 -
 103
103 -
 104
104 -
 105
105 -
 106
106 -
 107
107 -
 108
108 -
 109
109 -
 110
110 -
 111
111 -
 112
112 -
 113
113 -
 114
114 -
 115
115 -
 116
116 -
 117
117 -
 118
118 -
119
-
120
-
121
-
122
-
123
-
124
-
125
-
126
-
127
-
128
-
129
-
130
-
131
-
132
-
133
-
134
-
135
-
136
-
137
-
138
-
139
-
140
-
141
-
142
-
143
-
144
-
145
-
146
-
147
-
148
-
149
-
150
-
151
-
152
-
153
-
154
-
155
-
156
-
157
-
158
-
159
-
160
-
161
-
162
-
163
-
164
-
165
-
166
-
167
-
168
-
169
-
170
-
171
-
172
-
173
-
174
-
175
-
176
-
177
-
178
-
179
-
180
-
181
-
182
-
183
-
184
-
185
-
186
-
187
-
188
-
189
-
190
-
191
-
192
-
193
-
194
-
195
-
196
-
197
-
198
-
199
-
200
-
201
-
202
-
203
-
204
-
205
-
206
-
207
-
208
-
209
-
210
-
211
-
212
-
213
-
214
-
215
-
216
-
217
-
218
-
219
-
220
-
221
-
222
-
223
-
224
-
225
-
226
-
227
-
228
-
229
-
230
-
231
-
232
-
233
-
234
-
235
-
236
-
237
-
238
-
239
-
240
-
241
-
242
-
243
-
244
-
245
-
246
-
247
-
248
-
249
-
250
-
251
-
252
-
253
-
254
-
255
-
256
-
257
-
258
-
259
-
260
-
261
-
262
-
263
-
264
-
265
-
266
 |
 |

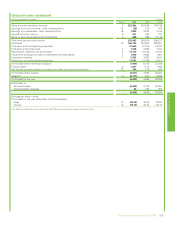
Group statement of comprehensive incomea
For the year ended 31 December $ million
Note 2015 2014 2013
Profit (loss) for the year (6,400) 4,003 23,758
Other comprehensive income
Items that may be reclassified subsequently to profit or loss
Currency translation differences (4,119) (6,838) (1,608)
Exchange gains (losses) on translation of foreign operations reclassified to gain or loss on sale of
businesses and fixed assets 23 51 22
Available-for-sale investments marked to market 1(1) (172)
Available-for-sale investments reclassified to the income statement –1 (523)
Cash flow hedges marked to market 29 (178) (155) (2,000)
Cash flow hedges reclassified to the income statement 29 249 (73) 4
Cash flow hedges reclassified to the balance sheet 29 22 (11) 17
Share of items relating to equity-accounted entities, net of tax (814) (2,584) (24)
Income tax relating to items that may be reclassified 8 257 147 147
(4,559) (9,463) (4,137)
Items that will not be reclassified to profit or loss
Remeasurements of the net pension and other post-retirement benefit liability or asset 23 4,139 (4,590) 4,764
Share of items relating to equity-accounted entities, net of tax (1) 42
Income tax relating to items that will not be reclassified 8 (1,397) 1,334 (1,521)
2,741 (3,252) 3,245
Other comprehensive income (1,818) (12,715) (892)
Total comprehensive income (8,218) (8,712) 22,866
Attributable to
BP shareholders (8,259) (8,903) 22,574
Non-controlling interests 41 191 292
(8,218) (8,712) 22,866
aSee Note 31 for further information.
Group statement of changes in equitya
$ million
Share
capital
and
capital
reserves
Treasury
shares
Foreign
currency
translation
reserve
Fair
value
reserves
Profit and
loss
account
BP
shareholders’
equity
Non-
controlling
interests
Total
equity
At 1 January 2015 43,902 (20,719) (3,409) (897) 92,564 111,441 1,201 112,642
Profit (loss) for the year – – – – (6,482) (6,482) 82 (6,400)
Other comprehensive income – – (3,858) 74 2,007 (1,777) (41) (1,818)
Total comprehensive income – – (3,858) 74 (4,475) (8,259) 41 (8,218)
Dividendsb– – – – (6,659) (6,659) (91) (6,750)
Share-based payments, net of tax – 755 – – (99) 656 – 656
Share of equity-accounted entities’ changes in equity, net of tax – – – – 40 40 – 40
Transactions involving non-controlling interests – – – – (3) (3) 20 17
At 31 December 2015 43,902 (19,964) (7,267) (823) 81,368 97,216 1,171 98,387
At 1 January 2014 43,656 (20,971) 3,525 (695) 103,787 129,302 1,105 130,407
Profit (loss) for the year – – – – 3,780 3,780 223 4,003
Other comprehensive income – – (6,934) (202) (5,547) (12,683) (32) (12,715)
Total comprehensive income – – (6,934) (202) (1,767) (8,903) 191 (8,712)
Dividendsb– – – – (5,850) (5,850) (255) (6,105)
Repurchases of ordinary share capital – – – – (3,366) (3,366) – (3,366)
Share-based payments, net of tax 246 252 – – (313) 185 – 185
Share of equity-accounted entities’ changes in equity, net of tax – – – – 73 73 – 73
Transactions involving non-controlling interests – – – – – – 160 160
At 31 December 2014 43,902 (20,719) (3,409) (897) 92,564 111,441 1,201 112,642
At 1 January 2013 43,513 (21,054) 5,128 1,775 89,184 118,546 1,206 119,752
Profit (loss) for the year – – – – 23,451 23,451 307 23,758
Other comprehensive income – – (1,603) (2,470) 3,196 (877) (15) (892)
Total comprehensive income – – (1,603) (2,470) 26,647 22,574 292 22,866
Dividendsb– – – – (5,441) (5,441) (469) (5,910)
Repurchases of ordinary share capital – – – – (6,923) (6,923) – (6,923)
Share-based payments, net of tax 143 83 – – 247 473 – 473
Share of equity-accounted entities’ changes in equity, net of tax – – – – 73 73 – 73
Transactions involving non-controlling interests – – – – – – 76 76
At 31 December 2013 43,656 (20,971) 3,525 (695) 103,787 129,302 1,105 130,407
aSee Note 31 for further information.
bSee Note 9 for further information.
104 BP Annual Report and Form 20-F 2015