BP 2015 Annual Report Download - page 114
Download and view the complete annual report
Please find page 114 of the 2015 BP annual report below. You can navigate through the pages in the report by either clicking on the pages listed below, or by using the keyword search tool below to find specific information within the annual report.-
 1
1 -
2
-
3
-
4
-
5
-
6
-
7
-
8
-
9
-
10
-
11
-
12
-
13
-
14
-
15
-
16
-
17
-
18
-
19
-
20
-
21
-
22
-
23
-
24
-
25
-
26
-
27
-
28
-
29
-
30
-
31
-
32
-
33
-
34
-
35
-
36
-
37
-
38
-
39
-
40
-
41
-
42
-
43
-
44
-
45
-
46
-
47
-
48
-
49
-
50
-
51
-
52
-
53
-
54
-
55
-
56
-
57
-
58
-
59
-
60
-
61
-
62
-
63
-
64
-
65
-
66
-
67
-
68
-
69
-
70
-
71
-
72
-
73
-
74
-
75
-
76
-
77
-
78
-
79
-
80
-
81
-
82
-
83
-
84
-
85
-
86
-
87
-
88
-
89
-
90
-
91
-
92
-
93
-
94
-
95
-
96
-
97
-
98
-
99
-
100
-
101
-
102
-
103
-
 104
104 -
 105
105 -
 106
106 -
 107
107 -
 108
108 -
 109
109 -
 110
110 -
 111
111 -
 112
112 -
 113
113 -
 114
114 -
 115
115 -
 116
116 -
 117
117 -
 118
118 -
 119
119 -
 120
120 -
 121
121 -
 122
122 -
 123
123 -
 124
124 -
125
-
126
-
127
-
128
-
129
-
130
-
131
-
132
-
133
-
134
-
135
-
136
-
137
-
138
-
139
-
140
-
141
-
142
-
143
-
144
-
145
-
146
-
147
-
148
-
149
-
150
-
151
-
152
-
153
-
154
-
155
-
156
-
157
-
158
-
159
-
160
-
161
-
162
-
163
-
164
-
165
-
166
-
167
-
168
-
169
-
170
-
171
-
172
-
173
-
174
-
175
-
176
-
177
-
178
-
179
-
180
-
181
-
182
-
183
-
184
-
185
-
186
-
187
-
188
-
189
-
190
-
191
-
192
-
193
-
194
-
195
-
196
-
197
-
198
-
199
-
200
-
201
-
202
-
203
-
204
-
205
-
206
-
207
-
208
-
209
-
210
-
211
-
212
-
213
-
214
-
215
-
216
-
217
-
218
-
219
-
220
-
221
-
222
-
223
-
224
-
225
-
226
-
227
-
228
-
229
-
230
-
231
-
232
-
233
-
234
-
235
-
236
-
237
-
238
-
239
-
240
-
241
-
242
-
243
-
244
-
245
-
246
-
247
-
248
-
249
-
250
-
251
-
252
-
253
-
254
-
255
-
256
-
257
-
258
-
259
-
260
-
261
-
262
-
263
-
264
-
265
-
266
 |
 |

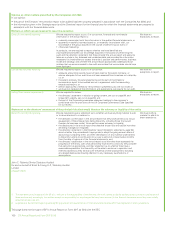
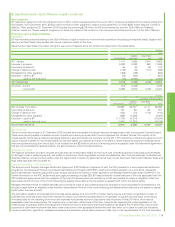
1. Significant accounting policies, judgements, estimates and assumptions – continued
Other property, plant and equipment is depreciated on a straight-line basis over its expected useful life. The typical useful lives of the group’s other
property, plant and equipment are as follows:
Land improvements 15 to 25 years
Buildings 20 to 50 years
Refineries 20 to 30 years
Petrochemicals plants 20 to 30 years
Pipelines 10 to 50 years
Service stations 15 years
Office equipment 3 to 7 years
Fixtures and fittings 5 to 15 years
The expected useful lives of property, plant and equipment are reviewed on an annual basis and, if necessary, changes in useful lives are accounted for
prospectively.
An item of property, plant and equipment is derecognized upon disposal or when no future economic benefits are expected to arise from the continued
use of the asset. Any gain or loss arising on derecognition of the asset (calculated as the difference between the net disposal proceeds and the
carrying amount of the item) is included in the income statement in the period in which the item is derecognized.
Significant estimate or judgement: estimation of oil and natural gas reserves
The determination of the group’s estimated oil and natural gas reserves requires significant judgements and estimates to be applied and these are
regularly reviewed and updated. Factors such as the availability of geological and engineering data, reservoir performance data, acquisition and
divestment activity, drilling of new wells, and commodity prices all impact on the determination of the group’s estimates of its oil and natural gas
reserves. BP bases its proved reserves estimates on the requirement of reasonable certainty with rigorous technical and commercial assessments
based on conventional industry practice and regulatory requirements.
The estimation of oil and natural gas reserves and BP’s process to manage reserves bookings is described in Supplementary information on oil and
natural gas on page 169, which is unaudited. Details on BP’s proved reserves and production compliance and governance processes are provided on
page 228.
Estimates of oil and natural gas reserves are used to calculate depreciation, depletion and amortization charges for the group’s oil and gas properties.
The impact of changes in estimated proved reserves is dealt with prospectively by amortizing the remaining carrying value of the asset over the
expected future production. Oil and natural gas reserves also have a direct impact on the assessment of the recoverability of asset carrying values
reported in the financial statements. If proved reserves estimates are revised downwards, earnings could be affected by changes in depreciation
expense or an immediate write-down of the property’s carrying value.
The 2015 movements in proved reserves are reflected in the tables showing movements in oil and natural gas reserves by region in Supplementary
information on oil and natural gas (unaudited) on page 169. Information on the carrying amounts of the group’s oil and natural gas properties,
together with the amounts recognized in the income statement as depreciation, depletion and amortization is contained in Note 11 and Note 5
respectively.
Impairment of property, plant and equipment, intangible assets, and goodwill
The group assesses assets or groups of assets, called cash-generating units (CGUs), for impairment whenever events or changes in circumstances
indicate that the carrying amount of an asset or CGU may not be recoverable; for example, changes in the group’s business plans, changes in the
group’s assumptions about commodity prices, low plant utilization, evidence of physical damage or, for oil and gas assets, significant downward
revisions of estimated reserves or increases in estimated future development expenditure or decommissioning costs. If any such indication of
impairment exists, the group makes an estimate of the asset’s or CGU’s recoverable amount. Individual assets are grouped into CGUs for impairment
assessment purposes at the lowest level at which there are identifiable cash flows that are largely independent of the cash flows of other groups of
assets. A CGU’s recoverable amount is the higher of its fair value less costs of disposal and its value in use. Where the carrying amount of a CGU
exceeds its recoverable amount, the CGU is considered impaired and is written down to its recoverable amount.
The business segment plans, which are approved on an annual basis by senior management, are the primary source of information for the
determination of value in use. They contain forecasts for oil and natural gas production, refinery throughputs, sales volumes for various types of refined
products (e.g. gasoline and lubricants), revenues, costs and capital expenditure. As an initial step in the preparation of these plans, various assumptions
regarding market conditions, such as oil prices, natural gas prices, refining margins, refined product margins and cost inflation rates are set by senior
management. These assumptions take account of existing prices, global supply-demand equilibrium for oil and natural gas, other macroeconomic
factors and historical trends and variability. In assessing value in use, the estimated future cash flows are adjusted for the risks specific to the asset
group and are discounted to their present value using a pre-tax discount rate that reflects current market assessments of the time value of money.
Fair value less costs of disposal is the price that would be received to sell the asset in an orderly transaction between market participants and does not
reflect the effects of factors that may be specific to the group and not applicable to entities in general.
An assessment is made at each reporting date as to whether there is any indication that previously recognized impairment losses may no longer exist
or may have decreased. If such an indication exists, the recoverable amount is estimated. A previously recognized impairment loss is reversed only if
there has been a change in the estimates used to determine the asset’s recoverable amount since the last impairment loss was recognized. If that is
the case, the carrying amount of the asset is increased to the lower of its recoverable amount and the carrying amount that would have been
determined, net of depreciation, had no impairment loss been recognized for the asset in prior years. Impairment reversals are recognized in profit or
loss. After a reversal, the depreciation charge is adjusted in future periods to allocate the asset’s revised carrying amount, less any residual value, on a
systematic basis over its remaining useful life.
Goodwill is reviewed for impairment annually or more frequently if events or changes in circumstances indicate the recoverable amount of the group
of cash-generating units to which the goodwill relates should be assessed. In assessing whether goodwill has been impaired, the carrying amount of
the group of CGUs to which goodwill has been allocated is compared with its recoverable amount. Where the recoverable amount of the group of
CGUs is less than the carrying amount (including goodwill), an impairment loss is recognized. An impairment loss recognized for goodwill is not
reversed in a subsequent period.
110 BP Annual Report and Form 20-F 2015