BP 2015 Annual Report Download - page 182
Download and view the complete annual report
Please find page 182 of the 2015 BP annual report below. You can navigate through the pages in the report by either clicking on the pages listed below, or by using the keyword search tool below to find specific information within the annual report.-
 1
1 -
2
-
3
-
4
-
5
-
6
-
7
-
8
-
9
-
10
-
11
-
12
-
13
-
14
-
15
-
16
-
17
-
18
-
19
-
20
-
21
-
22
-
23
-
24
-
25
-
26
-
27
-
28
-
29
-
30
-
31
-
32
-
33
-
34
-
35
-
36
-
37
-
38
-
39
-
40
-
41
-
42
-
43
-
44
-
45
-
46
-
47
-
48
-
49
-
50
-
51
-
52
-
53
-
54
-
55
-
56
-
57
-
58
-
59
-
60
-
61
-
62
-
63
-
64
-
65
-
66
-
67
-
68
-
69
-
70
-
71
-
72
-
73
-
74
-
75
-
76
-
77
-
78
-
79
-
80
-
81
-
82
-
83
-
84
-
85
-
86
-
87
-
88
-
89
-
90
-
91
-
92
-
93
-
94
-
95
-
96
-
97
-
98
-
99
-
100
-
101
-
102
-
103
-
104
-
105
-
106
-
107
-
108
-
109
-
110
-
111
-
112
-
113
-
114
-
115
-
116
-
117
-
118
-
119
-
120
-
121
-
122
-
123
-
124
-
125
-
126
-
127
-
128
-
129
-
130
-
131
-
132
-
133
-
134
-
135
-
136
-
137
-
138
-
139
-
140
-
141
-
142
-
143
-
144
-
145
-
146
-
147
-
148
-
149
-
150
-
151
-
152
-
153
-
154
-
155
-
156
-
157
-
158
-
159
-
160
-
161
-
162
-
163
-
164
-
165
-
166
-
167
-
168
-
169
-
170
-
171
-
 172
172 -
 173
173 -
 174
174 -
 175
175 -
 176
176 -
 177
177 -
 178
178 -
 179
179 -
 180
180 -
 181
181 -
 182
182 -
 183
183 -
 184
184 -
 185
185 -
 186
186 -
 187
187 -
 188
188 -
 189
189 -
 190
190 -
 191
191 -
 192
192 -
193
-
194
-
195
-
196
-
197
-
198
-
199
-
200
-
201
-
202
-
203
-
204
-
205
-
206
-
207
-
208
-
209
-
210
-
211
-
212
-
213
-
214
-
215
-
216
-
217
-
218
-
219
-
220
-
221
-
222
-
223
-
224
-
225
-
226
-
227
-
228
-
229
-
230
-
231
-
232
-
233
-
234
-
235
-
236
-
237
-
238
-
239
-
240
-
241
-
242
-
243
-
244
-
245
-
246
-
247
-
248
-
249
-
250
-
251
-
252
-
253
-
254
-
255
-
256
-
257
-
258
-
259
-
260
-
261
-
262
-
263
-
264
-
265
-
266
 |
 |

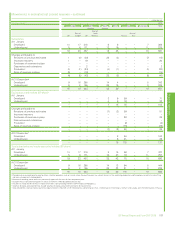
Movements in estimated net proved reserves – continued
million barrels
Total liquidsab 2015
Europe North
America
South
America
Africa Asia Australasia Total
UK
Rest of
Europe USc
Rest of
North
America Russia
Rest of
Asia
Subsidiaries
At 1 January
Developed 166 108 1,352 9 21 322 – 384 46 2,407
Undeveloped 332 23 769 163 50 127 – 197 22 1,684
497 131 2,121 172 71 449 – 581 68 4,092
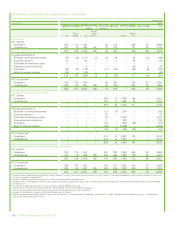
Changes attributable to
Revisions of previous estimates (20) 2 (210) 39 (2) 86 – 295 1 191
Improved recovery – – 28 – – 2 – – – 30
Purchases of reserves-in-place 1–3– –6–– –11
Discoveries and extensions ––442 –2–– –48
Productiond(29) (16) (138) (1) (8) (101) – (87) (7) (387)
Sales of reserves-in-place (1)–(1)– –––– – (2)
(48) (14) (315) 80 (10) (5) – 208 (6) (109)
At 31 Decembere
Developed 147 98 1,159 46 15 346 – 598 45 2,453
Undeveloped 302 20 647 205 46 99 – 192 18 1,529
449 117 1,806 252 61 444 – 790 63 3,982
Equity-accounted entities (BP share)f
At 1 January
Developed – – – – 316 17 3,028 89 – 3,451
Undeveloped – – – – 314 – 1,949 11 – 2,274
– – – 1 630 17 4,976 101 – 5,725
Changes attributable to
Revisions of previous estimates – – – – 9 (3) (22) 3 – (13)
Improved recovery –––– 3––– – 3
Purchases of reserves-in-place –––– ––28– –28
Discoveries and extensions – – – – 9 – 185 – – 194
Production – – – – (28) – (295) (35) – (358)
Sales of reserves-in-place – – – – – – (1) – – (1)
– – – (1) (8) (3) (104) (32) – (147)
At 31 Decembergh
Developed – – – – 311 14 2,876 68 – 3,270
Undeveloped – – – – 312 – 1,996 – – 2,307
– – – – 622 14 4,872 68 – 5,577
Total subsidiaries and equity-accounted entities (BP share)
At 1 January
Developed 166 108 1,352 9 337 339 3,028 473 46 5,858
Undeveloped 332 23 769 164 364 127 1,949 208 22 3,958
497 131 2,121 173 701 466 4,976 682 68 9,817
At 31 December
Developed 147 98 1,159 47 326 360 2,876 666 45 5,723
Undeveloped 302 20 647 205 357 99 1,996 192 18 3,836
449 117 1,806 252 684 459 4,872 858 63 9,560
aProved reserves exclude royalties due to others, whether payable in cash or in kind, where the royalty owner has a direct interest in the underlying production and the option and ability to make lifting
and sales arrangements independently.
bBecause of rounding, some totals may not exactly agree with the sum of their component parts.
cProved reserves in the Prudhoe Bay field in Alaska include an estimated 23 million barrels of oil equivalent upon which a net profits royalty will be payable, over the life of the field under the terms of
the BP Prudhoe Bay Royalty Trust.
dExcludes NGLs from processing plants in which an interest is held of less than 1 thousand barrels per day for subsidiaries and 4 thousand barrels per day for equity-accounted entities.
eAlso includes 19 million barrels in respect of the 30% non-controlling interest in BP Trinidad and Tobago LLC.
fVolumes of equity-accounted entities include volumes of equity-accounted investments of those entities.
gIncludes 70 million barrels in respect of the non-controlling interest in Rosneft, including 28 mmboe held through BP’s equity-accounted interest in Taas-Yuryakh Neftegazodobycha.
hTotal proved liquid reserves held as part of our equity interest in Rosneft is 4,871 million barrels, comprising less than 1 million barrels in Canada, 26 million barrels in Venezuela, less than 1 million
barrels in Vietnam and 4,844 million barrels in Russia.
178 BP Annual Report and Form 20-F 2015