BP 2015 Annual Report Download - page 115
Download and view the complete annual report
Please find page 115 of the 2015 BP annual report below. You can navigate through the pages in the report by either clicking on the pages listed below, or by using the keyword search tool below to find specific information within the annual report.-
 1
1 -
2
-
3
-
4
-
5
-
6
-
7
-
8
-
9
-
10
-
11
-
12
-
13
-
14
-
15
-
16
-
17
-
18
-
19
-
20
-
21
-
22
-
23
-
24
-
25
-
26
-
27
-
28
-
29
-
30
-
31
-
32
-
33
-
34
-
35
-
36
-
37
-
38
-
39
-
40
-
41
-
42
-
43
-
44
-
45
-
46
-
47
-
48
-
49
-
50
-
51
-
52
-
53
-
54
-
55
-
56
-
57
-
58
-
59
-
60
-
61
-
62
-
63
-
64
-
65
-
66
-
67
-
68
-
69
-
70
-
71
-
72
-
73
-
74
-
75
-
76
-
77
-
78
-
79
-
80
-
81
-
82
-
83
-
84
-
85
-
86
-
87
-
88
-
89
-
90
-
91
-
92
-
93
-
94
-
95
-
96
-
97
-
98
-
99
-
100
-
101
-
102
-
103
-
104
-
 105
105 -
 106
106 -
 107
107 -
 108
108 -
 109
109 -
 110
110 -
 111
111 -
 112
112 -
 113
113 -
 114
114 -
 115
115 -
 116
116 -
 117
117 -
 118
118 -
 119
119 -
 120
120 -
 121
121 -
 122
122 -
 123
123 -
 124
124 -
 125
125 -
126
-
127
-
128
-
129
-
130
-
131
-
132
-
133
-
134
-
135
-
136
-
137
-
138
-
139
-
140
-
141
-
142
-
143
-
144
-
145
-
146
-
147
-
148
-
149
-
150
-
151
-
152
-
153
-
154
-
155
-
156
-
157
-
158
-
159
-
160
-
161
-
162
-
163
-
164
-
165
-
166
-
167
-
168
-
169
-
170
-
171
-
172
-
173
-
174
-
175
-
176
-
177
-
178
-
179
-
180
-
181
-
182
-
183
-
184
-
185
-
186
-
187
-
188
-
189
-
190
-
191
-
192
-
193
-
194
-
195
-
196
-
197
-
198
-
199
-
200
-
201
-
202
-
203
-
204
-
205
-
206
-
207
-
208
-
209
-
210
-
211
-
212
-
213
-
214
-
215
-
216
-
217
-
218
-
219
-
220
-
221
-
222
-
223
-
224
-
225
-
226
-
227
-
228
-
229
-
230
-
231
-
232
-
233
-
234
-
235
-
236
-
237
-
238
-
239
-
240
-
241
-
242
-
243
-
244
-
245
-
246
-
247
-
248
-
249
-
250
-
251
-
252
-
253
-
254
-
255
-
256
-
257
-
258
-
259
-
260
-
261
-
262
-
263
-
264
-
265
-
266
 |
 |

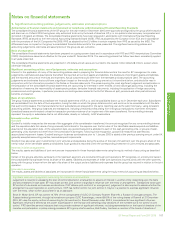
1. Significant accounting policies, judgements, estimates and assumptions – continued
Significant estimate or judgement: recoverability of asset carrying values
Determination as to whether, and by how much, an asset, CGU, or group of CGUs containing goodwill is impaired involves management estimates
on highly uncertain matters such as future commodity prices, the effects of inflation on operating expenses, discount rates, production profiles and
the outlook for global or regional market supply-and-demand conditions for crude oil, natural gas and refined products.
For oil and natural gas properties, the expected future cash flows are estimated using management’s best estimate of future oil and natural gas
prices and production and reserves volumes. Judgement is also required when determining the appropriate grouping of assets into a CGU or the
appropriate grouping of CGUs for impairment testing purposes.
The estimated future level of production in all impairment tests is based on assumptions about future commodity prices, production and
development costs, field decline rates, current fiscal regimes and other factors.
Fair value less costs of disposal may be determined based on similar recent market transaction data or, where recent market transactions for the
asset are not available for reference, using discounted cash flow techniques. Where discounted cash flow analyses are used to calculate fair value
less costs of disposal, accounting judgements are made about the assumptions market participants would use when pricing the asset, CGU or
group of CGUs containing goodwill and the test is performed on a post-tax basis. The post-tax discount rate used is based upon the cost of funding
the group derived from an established model. Adjustments are made, where applicable, to take into account any specific risks relating to the country
where the cash-generating unit is located. In 2015 the discount rate used to determine recoverable amounts based on fair value less costs of
disposal was 7% (2014 8%), with a 2% premium added in higher-risk countries.
When estimating the fair value of our Upstream assets, assumptions reflect all reserves that a market participant would consider when valuing the
asset, which are usually broader in scope than the reserves used in a value-in-use test. Discounted cash flow analyses used to calculate fair value
less costs of disposal use market prices for the first five years and long-term price assumptions that are consistent with the assumptions used by
the group for investment appraisal purposes thereafter. The long-term price assumptions used in such tests are $90 per barrel for Brent in 2021
(2014 $97 per barrel in 2020) and $5.60/mmBtu for Henry Hub in 2021 (2014 $6.00/mmBtu in 2020), both inflated at a rate of 2% per annum for the
remaining life of the asset (2014 2.5%). These long-term assumptions are derived from the $80 per barrel real oil price and $5/mmBtu real Henry
Hub assumptions used for investment appraisal. In the current price environment, the market prices used for the first five years of both value-in-use
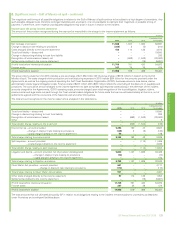
and fair value less costs of disposal impairment tests are particularly volatile. Market prices used for the first five years of both value-in-use and fair
value less costs of disposal impairment tests performed at the year end are shown in the table below:
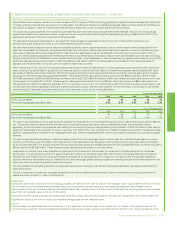
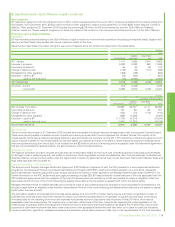
Price assumptions for the first five years as at 31 December 2015
2016 2017 2018 2019 2020
Brent oil price ($/bbl) 40 47 52 54 56
Henry Hub natural gas price ($/mmBtu) 2.38 2.76 2.90 3.03 3.18
as at 31 December 2014
2015 2016 2017 2018 2019
Brent oil price ($/bbl) 61 69 73 76 77
Henry Hub natural gas price ($/mmBtu) 3.11 3.53 3.82 4.00 4.15
For value-in-use calculations, future cash flows are adjusted for risks specific to the cash-generating unit and are discounted using a pre-tax discount
rate. The pre-tax discount rate is derived from the cost of funding the group calculated using an established model, and is adjusted, where
applicable, to take into account any specific risks relating to the country where the cash-generating unit is located. In 2015 the discount rate used to
determine recoverable amounts based on value in use was 11% (2014 12%), with a 2% premium added in higher-risk countries. The discount rates
applied in assessments of impairment are reassessed each year. Reserves assumptions for value-in-use tests are restricted to proved and probable
reserves.
For value-in-use calculations relating to Upstream assets, prices for oil and natural gas used for future cash flow calculations are based on market
prices for the first five years (consistent with those shown in the table above) and the group’s flat nominal long-term price assumptions thereafter.
As at 31 December 2015, the group’s long-term flat nominal price assumptions were $90 per barrel for Brent and $6.50/mmBtu for Henry Hub (2014
$90 per barrel and $6.50/mmBtu). These long-term price assumptions are subject to periodic review.
Irrespective of whether there is any indication of impairment, BP is required to test annually for impairment of goodwill acquired in a business
combination. The group carries goodwill of approximately $11.6 billion on its balance sheet (2014 $11.9 billion), principally relating to the Atlantic
Richfield, Burmah Castrol, Devon Energy and Reliance transactions. In testing goodwill for impairment, the group uses the approach described
above to determine recoverable amount. If there are low oil or natural gas prices, refining margins or marketing margins for an extended period, the
group may need to recognize goodwill impairment charges.
The recoverability of intangible exploration and appraisal expenditure is covered under Oil and natural gas exploration, appraisal and development
expenditure above.
Details of impairment charges and reversals recognized in the income statement are provided in Note 4 and details on the carrying amounts of
assets are shown in Note 11, Note 13 and Note 14.
Inventories
Inventories, other than inventories held for trading purposes, are stated at the lower of cost and net realizable value. Cost is determined by the first-in
first-out method and comprises direct purchase costs, cost of production, transportation and manufacturing expenses. Net realizable value is
determined by reference to prices existing at the balance sheet date, adjusted where the sale of inventories after the reporting period gives evidence
about their net realizable value at the end of the period.
Inventories held for trading purposes are stated at fair value less costs to sell and any changes in fair value are recognized in the income statement.
Supplies are valued at the lower of cost on a weighted average basis and net realizable value.
Leases
Finance leases are capitalized at the commencement of the lease term at the fair value of the leased item or, if lower, at the present value of the
minimum lease payments. Finance charges are allocated to each period so as to achieve a constant rate of interest on the remaining balance of the
BP Annual Report and Form 20-F 2015 111
Financial statements