BP 2015 Annual Report Download - page 126
Download and view the complete annual report
Please find page 126 of the 2015 BP annual report below. You can navigate through the pages in the report by either clicking on the pages listed below, or by using the keyword search tool below to find specific information within the annual report.-
 1
1 -
2
-
3
-
4
-
5
-
6
-
7
-
8
-
9
-
10
-
11
-
12
-
13
-
14
-
15
-
16
-
17
-
18
-
19
-
20
-
21
-
22
-
23
-
24
-
25
-
26
-
27
-
28
-
29
-
30
-
31
-
32
-
33
-
34
-
35
-
36
-
37
-
38
-
39
-
40
-
41
-
42
-
43
-
44
-
45
-
46
-
47
-
48
-
49
-
50
-
51
-
52
-
53
-
54
-
55
-
56
-
57
-
58
-
59
-
60
-
61
-
62
-
63
-
64
-
65
-
66
-
67
-
68
-
69
-
70
-
71
-
72
-
73
-
74
-
75
-
76
-
77
-
78
-
79
-
80
-
81
-
82
-
83
-
84
-
85
-
86
-
87
-
88
-
89
-
90
-
91
-
92
-
93
-
94
-
95
-
96
-
97
-
98
-
99
-
100
-
101
-
102
-
103
-
104
-
105
-
106
-
107
-
108
-
109
-
110
-
111
-
112
-
113
-
114
-
115
-
 116
116 -
 117
117 -
 118
118 -
 119
119 -
 120
120 -
 121
121 -
 122
122 -
 123
123 -
 124
124 -
 125
125 -
 126
126 -
 127
127 -
 128
128 -
 129
129 -
 130
130 -
 131
131 -
 132
132 -
 133
133 -
 134
134 -
 135
135 -
 136
136 -
137
-
138
-
139
-
140
-
141
-
142
-
143
-
144
-
145
-
146
-
147
-
148
-
149
-
150
-
151
-
152
-
153
-
154
-
155
-
156
-
157
-
158
-
159
-
160
-
161
-
162
-
163
-
164
-
165
-
166
-
167
-
168
-
169
-
170
-
171
-
172
-
173
-
174
-
175
-
176
-
177
-
178
-
179
-
180
-
181
-
182
-
183
-
184
-
185
-
186
-
187
-
188
-
189
-
190
-
191
-
192
-
193
-
194
-
195
-
196
-
197
-
198
-
199
-
200
-
201
-
202
-
203
-
204
-
205
-
206
-
207
-
208
-
209
-
210
-
211
-
212
-
213
-
214
-
215
-
216
-
217
-
218
-
219
-
220
-
221
-
222
-
223
-
224
-
225
-
226
-
227
-
228
-
229
-
230
-
231
-
232
-
233
-
234
-
235
-
236
-
237
-
238
-
239
-
240
-
241
-
242
-
243
-
244
-
245
-
246
-
247
-
248
-
249
-
250
-
251
-
252
-
253
-
254
-
255
-
256
-
257
-
258
-
259
-
260
-
261
-
262
-
263
-
264
-
265
-
266
 |
 |

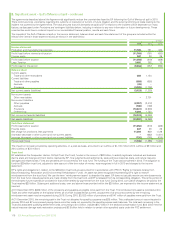
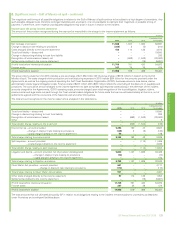
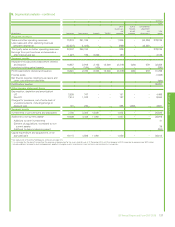
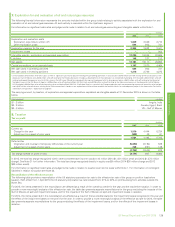
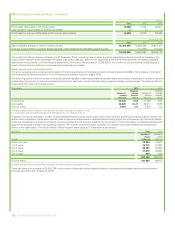
3. Non-current assets held for sale
On 15 January 2016 BP and Rosneft announced that they had signed a binding agreement to dissolve the German refining joint operation Ruhr Oel
GmbH (ROG). The restructuring, which is expected to be completed in 2016, will result in the transfer of BP’s interests, currently held via ROG, in the
Bayernoil, MiRO Karlsruhe and PCK Schwedt refineries to Rosneft. In exchange, BP will take sole ownership of the Gelsenkirchen refinery and the
solvent production facility DHC Solvent Chemie, both of which are also currently owned by ROG.
The major classes of assets and liabilities relating to BP’s share of ROG’s interests in the Bayernoil, MiRO Karlsruhe and PCK Schwedt refineries
classified as held for sale at 31 December 2015 were:
$ million
2015
Assets
Property, plant and equipment 360
Intangible assets 3
Inventories 215
Assets classified as held for sale 578
Liabilities
Defined benefit pension plan and other post-retirement benefit plan deficits (97)
Liabilities directly associated with assets classified as held for sale (97)
The assets classified as held for sale are reported in the Downstream segment. The associated pension liabilities are reported in Other businesses and
corporate.
There were no assets or liabilities classified as held for sale as at 31 December 2014.
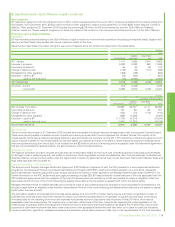
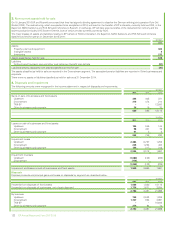
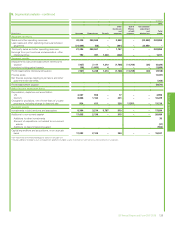
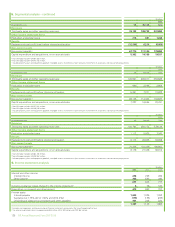
4. Disposals and impairment
The following amounts were recognized in the income statement in respect of disposals and impairments.
$ million
2015 2014 2013
Gains on sale of businesses and fixed assets
Upstream 324 405 371
Downstream 316 474 214
TNK-BP –– 12,500
Other businesses and corporate 26 16 30
666 895 13,115
$ million
2015 2014 2013
Losses on sale of businesses and fixed assets
Upstream 124 345 144
Downstream 98 401 78
Other businesses and corporate 41 38
263 749 230
Impairment losses
Upstream 2,484 6,737 1,255
Downstream 265 1,264 484
Other businesses and corporate 155 317 218
2,904 8,318 1,957
Impairment reversals
Upstream (1,080) (102) (226)
Downstream (178) ––
(1,258) (102) (226)
Impairment and losses on sale of businesses and fixed assets 1,909 8,965 1,961
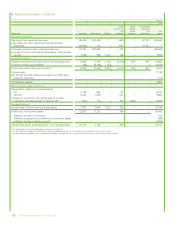
Disposals
Disposal proceeds and principal gains and losses on disposals by segment are described below.
$ million
2015 2014 2013
Proceeds from disposals of fixed assets 1,066 1,820 18,115
Proceeds from disposals of businesses, net of cash disposed 1,726 1,671 3,884
2,792 3,491 21,999
By business
Upstream 769 2,533 1,288
Downstream 1,747 864 3,991
TNK-BP –– 16,646
Other businesses and corporate 276 94 74
2,792 3,491 21,999
122 BP Annual Report and Form 20-F 2015