BP 2015 Annual Report Download - page 236
Download and view the complete annual report
Please find page 236 of the 2015 BP annual report below. You can navigate through the pages in the report by either clicking on the pages listed below, or by using the keyword search tool below to find specific information within the annual report.-
 1
1 -
2
-
3
-
4
-
5
-
6
-
7
-
8
-
9
-
10
-
11
-
12
-
13
-
14
-
15
-
16
-
17
-
18
-
19
-
20
-
21
-
22
-
23
-
24
-
25
-
26
-
27
-
28
-
29
-
30
-
31
-
32
-
33
-
34
-
35
-
36
-
37
-
38
-
39
-
40
-
41
-
42
-
43
-
44
-
45
-
46
-
47
-
48
-
49
-
50
-
51
-
52
-
53
-
54
-
55
-
56
-
57
-
58
-
59
-
60
-
61
-
62
-
63
-
64
-
65
-
66
-
67
-
68
-
69
-
70
-
71
-
72
-
73
-
74
-
75
-
76
-
77
-
78
-
79
-
80
-
81
-
82
-
83
-
84
-
85
-
86
-
87
-
88
-
89
-
90
-
91
-
92
-
93
-
94
-
95
-
96
-
97
-
98
-
99
-
100
-
101
-
102
-
103
-
104
-
105
-
106
-
107
-
108
-
109
-
110
-
111
-
112
-
113
-
114
-
115
-
116
-
117
-
118
-
119
-
120
-
121
-
122
-
123
-
124
-
125
-
126
-
127
-
128
-
129
-
130
-
131
-
132
-
133
-
134
-
135
-
136
-
137
-
138
-
139
-
140
-
141
-
142
-
143
-
144
-
145
-
146
-
147
-
148
-
149
-
150
-
151
-
152
-
153
-
154
-
155
-
156
-
157
-
158
-
159
-
160
-
161
-
162
-
163
-
164
-
165
-
166
-
167
-
168
-
169
-
170
-
171
-
172
-
173
-
174
-
175
-
176
-
177
-
178
-
179
-
180
-
181
-
182
-
183
-
184
-
185
-
186
-
187
-
188
-
189
-
190
-
191
-
192
-
193
-
194
-
195
-
196
-
197
-
198
-
199
-
200
-
201
-
202
-
203
-
204
-
205
-
206
-
207
-
208
-
209
-
210
-
211
-
212
-
213
-
214
-
215
-
216
-
217
-
218
-
219
-
220
-
221
-
222
-
223
-
224
-
225
-
 226
226 -
 227
227 -
 228
228 -
 229
229 -
 230
230 -
 231
231 -
 232
232 -
 233
233 -
 234
234 -
 235
235 -
 236
236 -
 237
237 -
 238
238 -
 239
239 -
 240
240 -
 241
241 -
 242
242 -
 243
243 -
 244
244 -
 245
245 -
 246
246 -
247
-
248
-
249
-
250
-
251
-
252
-
253
-
254
-
255
-
256
-
257
-
258
-
259
-
260
-
261
-
262
-
263
-
264
-
265
-
266
 |
 |

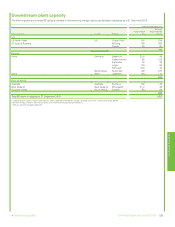
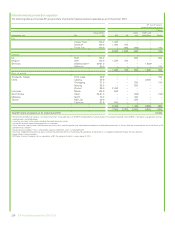
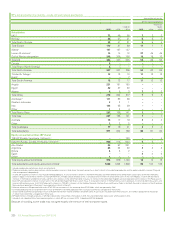
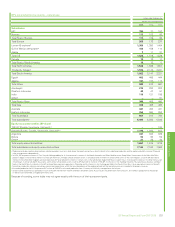
The following tables provide additional data and disclosures in relation to our oil and gas operations.
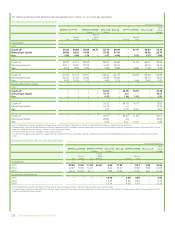
Average sales price per unit of productiona
$ per unit of production
Europe North
America
South
America
Africa Asia Australasia
Total
group
average
UK
Rest of
Europe US
Rest of
North
America Russiab
Rest of
Asia
Subsidiaries
2015
Crude oilc52.42 50.68 49.84 26.71 53.19 49.09 – 41.41 50.64 47.78
Natural gas liquids 30.66 28.20 14.80 – 27.66 31.94 – – 36.69 20.75
Gas 7.83 6.49 2.10 – 2.67 4.40 – 5.35 7.35 3.80
2014
Crude oilc96.02 97.77 93.66 – 96.85 93.99 – 91.05 94.04 93.65
Natural gas liquids 58.11 52.97 32.28 – 41.62 53.67 – – 65.70 36.15
Gas 8.13 8.22 3.80 – 4.65 5.92 – 6.28 11.20 5.70
2013
Crude oilc107.83 107.78 102.07 – 106.37 107.02 – 108.26 105.89 105.38
Natural gas liquids 62.53 61.82 30.95 – 54.92 69.39 – – 68.13 38.38
Gas 9.43 10.18 3.07 – 4.66 5.75 – 4.99 10.55 5.35
Equity-accounted entitiesd
2015
Crude oilc– – – – 54.24 – 44.78 16.87 – 41.49
Natural gas liquids – – – – 13.17 – n/a – – 13.17
Gas – – – – 4.35 – 1.48 7.56 – 2.35
2014
Crude oilc– – – – 73.87 – 84.19 14.70 – 72.53
Natural gas liquids – – – – 15.75 – n/a – – 15.75
Gas – – – – 4.73 – 2.18 12.83 – 3.01
2013
Crude oilc– – – – 74.01 – 95.28 11.58 – 63.51
Natural gas liquids – – – – 29.63 – n/a – – 29.63
Gas – – – – 4.05 – 2.47 13.21 – 3.26
aUnits of production are barrels for liquids and thousands of cubic feet for gas. Realizations*include transfers between businesses, except in the case of Russia.
bThe operational and financial information of the Rosneft segment for 2015 is based on preliminary operational and financial results of Rosneft for the three months ended 31 December 2015. Actual
results may differ from these amounts. Crude oil includes natural gas liquids.
cIncludes condensate. 2015 for subsidiaries also includes bitumen.
dIt is common for equity-accounted entities’ agreements to include pricing clauses that require selling a significant portion of the entitled production to local governments or markets at discounted
prices.
Average production cost per unit of productiona
$ per unit of production
Europe North
America
South
America
Africa Asia Australasia
Total
group
average
UK
Rest of
Europe US
Rest of
North
America Russiab
Rest of
Asia
Subsidiaries
2015 22.95 13.80 11.84 43.56 5.44 11.02 – 9.81 2.88 10.26
2014 44.67 18.85 14.22 – 5.43 13.37 – 15.55 3.92 12.68
2013 34.10 24.48 16.11 – 5.92 13.84 – 13.20 3.21 13.16
Equity-accounted entities
2015 – – – – 12.10 – 2.60 4.59 – 3.93
2014 – – – – 11.28 – 3.82 4.34 – 4.75
2013 – – – – 12.16 – 4.36 4.19 – 5.28
aUnits of production are barrels for liquids and thousands of cubic feet for gas. Amounts do not include ad valorem and severance taxes.
bThe operational and financial information of the Rosneft segment for 2015 is based on preliminary operational and financial results of Rosneft for the three months ended 31 December 2015. Actual
results may differ from these amounts.
232 BP Annual Report and Form 20-F 2015