BP 2015 Annual Report Download - page 34
Download and view the complete annual report
Please find page 34 of the 2015 BP annual report below. You can navigate through the pages in the report by either clicking on the pages listed below, or by using the keyword search tool below to find specific information within the annual report.-
 1
1 -
2
-
3
-
4
-
5
-
6
-
7
-
8
-
9
-
10
-
11
-
12
-
13
-
14
-
15
-
16
-
17
-
18
-
19
-
20
-
21
-
22
-
23
-
 24
24 -
 25
25 -
 26
26 -
 27
27 -
 28
28 -
 29
29 -
 30
30 -
 31
31 -
 32
32 -
 33
33 -
 34
34 -
 35
35 -
 36
36 -
 37
37 -
 38
38 -
 39
39 -
 40
40 -
 41
41 -
 42
42 -
 43
43 -
 44
44 -
45
-
46
-
47
-
48
-
49
-
50
-
51
-
52
-
53
-
54
-
55
-
56
-
57
-
58
-
59
-
60
-
61
-
62
-
63
-
64
-
65
-
66
-
67
-
68
-
69
-
70
-
71
-
72
-
73
-
74
-
75
-
76
-
77
-
78
-
79
-
80
-
81
-
82
-
83
-
84
-
85
-
86
-
87
-
88
-
89
-
90
-
91
-
92
-
93
-
94
-
95
-
96
-
97
-
98
-
99
-
100
-
101
-
102
-
103
-
104
-
105
-
106
-
107
-
108
-
109
-
110
-
111
-
112
-
113
-
114
-
115
-
116
-
117
-
118
-
119
-
120
-
121
-
122
-
123
-
124
-
125
-
126
-
127
-
128
-
129
-
130
-
131
-
132
-
133
-
134
-
135
-
136
-
137
-
138
-
139
-
140
-
141
-
142
-
143
-
144
-
145
-
146
-
147
-
148
-
149
-
150
-
151
-
152
-
153
-
154
-
155
-
156
-
157
-
158
-
159
-
160
-
161
-
162
-
163
-
164
-
165
-
166
-
167
-
168
-
169
-
170
-
171
-
172
-
173
-
174
-
175
-
176
-
177
-
178
-
179
-
180
-
181
-
182
-
183
-
184
-
185
-
186
-
187
-
188
-
189
-
190
-
191
-
192
-
193
-
194
-
195
-
196
-
197
-
198
-
199
-
200
-
201
-
202
-
203
-
204
-
205
-
206
-
207
-
208
-
209
-
210
-
211
-
212
-
213
-
214
-
215
-
216
-
217
-
218
-
219
-
220
-
221
-
222
-
223
-
224
-
225
-
226
-
227
-
228
-
229
-
230
-
231
-
232
-
233
-
234
-
235
-
236
-
237
-
238
-
239
-
240
-
241
-
242
-
243
-
244
-
245
-
246
-
247
-
248
-
249
-
250
-
251
-
252
-
253
-
254
-
255
-
256
-
257
-
258
-
259
-
260
-
261
-
262
-
263
-
264
-
265
-
266
 |
 |

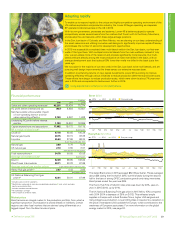
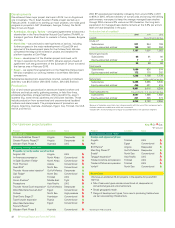
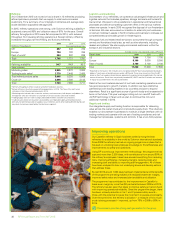
Financial results
Sales and other operating revenues for 2015 decreased compared with
2014, primarily reflecting significantly lower liquids and gas realizations and
lower gas marketing and trading revenues partly offset by higher production.
The decrease in 2014 compared with 2013 primarily reflected lower liquids
realizations partially offset by higher production in higher-margin areas, higher
gas realizations and higher gas marketing and trading revenues.
Replacement cost (RC) loss before interest and tax for the segment
included a net non-operating charge of $2,235 million. This is primarily
related to a net impairment charge associated with a number of assets,
following a further fall in oil and gas prices and changes to other
assumptions. See Financial statements – Note 4 for further information.
Fair value accounting effects had a favourable impact of $105 million
relative to management’s view of performance.
The 2014 result included a net non-operating charge of $6,298 million,
primarily related to impairments associated with several assets, mainly in
the North Sea and Angola reflecting the impact of the lower near-term
price environment, revisions to reserves and increases in expected
decommissioning cost estimates. Fair value accounting effects had a
favourable impact of $31 million relative to management’s view of
performance. The 2013 result included a net non-operating charge of
$1,364 million, which included an $845-million write-off attributable to
block BM-CAL-13 offshore Brazil, as a result of the Pitanga exploration well
not encountering commercial quantities of oil or gas, and an unfavourable
impact of $244 million from fair value accounting effects.
After adjusting for non-operating items and fair value accounting effects,
the decrease in the underlying RC profit before interest and tax compared
with 2014 reflected significantly lower liquids and gas realizations, rig
cancellation charges and lower gas marketing and trading results partly
offset by lower costs including benefits from simplification and efficiency
activities and lower exploration write-offs, and higher production.
Compared with 2013 the 2014 result reflected lower liquids realizations,
higher costs, mainly depreciation, depletion and amortization and
exploration write-offs and the absence of one-off benefits which occurred
in 2013. This was partly offset by higher production in higher-margin areas,
higher gas realizations and a benefit from stronger gas marketing and
trading activities.
Total capital expenditure including acquisitions and asset exchanges in
2015 was lower compared with 2014. This included $100 million capital
expenditure before closing adjustments in 2015 relating to the purchase of
additional equity in the West Nile Delta concessions in Egypt and $81
million capital expenditure before closing adjustments relating to the
purchase of additional equity in the Northeast Blanco and 32-9
concessions in the San Juan basin onshore US.
In total, disposal transactions generated $0.8 billion in proceeds in 2015,
with a corresponding reduction in net proved reserves of 20mmboe within
our subsidiaries.
The major disposal transaction during 2015 was the sale of our 36%
interest in the Central Area Transmission System (CATS) business in the
UK North Sea to Antin Infrastructure Partners. More information on
disposals is provided in Upstream analysis by region on page 221 and
Financial statements – Note 4.
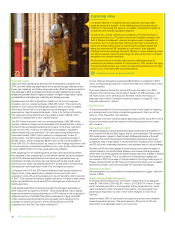
Exploration
The group explores for oil and natural gas under a wide range of licensing,
joint arrangement and other contractual agreements. We may do this
alone or, more frequently, with partners.
In exploration we have reduced capital spending by 50% since 2014 with a
focus on prioritizing near-term activity while creating options for longer-
term renewal.
New access in 2015
We gained access to new potential resources covering almost 8,000km2 in
four countries (UK (North Sea), Egypt, the US, and Azerbaijan). We acquired a
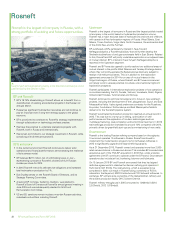
20% participatory interest in Taas-Yuryakh Neftegazodobycha, a Rosneft
subsidiary that will further develop the Srednebotuobinskoye oil and gas
condensate field in East Siberia, in November 2015. Related to this, Rosneft
and BP will jointly undertake exploration in an adjacent area of mutual interest.
Rosneft and BP have also agreed to jointly explore two additional areas of
mutual interest in the prolific West Siberian and Yenisey-Khatanga basins
where they will jointly appraise the Baikalovskoye discovery subject to receipt
of all relevant consents. This is in addition to the exploration agreement
announced in 2014 for an area of mutual interest in the Volga-Urals region of
Russia, where Rosneft and BP have commenced joint study work to assess
potential non-shale, unconventional tight-oil exploration prospects.
Exploration success
We participated in two potentially commercial discoveries in Egypt – Atoll and
Nooros in 2015.
Exploration and appraisal costs
Excluding lease acquisitions, the costs for exploration and appraisal
were $1,794 million (2014 $2,911 million, 2013 $4,811 million). These
costs included exploration and appraisal drilling expenditures, which
were capitalized within intangible fixed assets, and geological and
geophysical exploration costs, which were charged to income as
incurred.
Approximately 26% of exploration and appraisal costs were directed
towards appraisal activity. We participated in 29 gross (16.76 net)
exploration and appraisal wells in six countries.
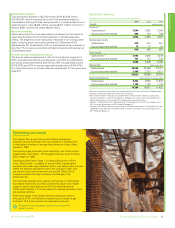
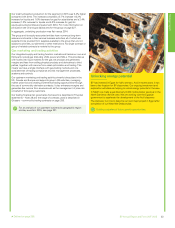
Capturing value
Continued declines in oil prices have put upstream earnings under
pressure across the industry. In this challenging environment we are
focused on maximizing the value of our assets, improving the quality of
investment and maintaining capital discipline.
As part of this, we are reviewing our projects to find opportunities to
improve their value. Our Thunder Horse South Expansion project in the
Gulf of Mexico is designed to sustain and grow quality deepwater oil
production from our existing field. We have been able to simplify our
plans and reduce drilling costs by examining the project’s scope and
costs and working with BP suppliers to use more of their standard
offerings that take advantage of current deflation in price. Adopting newer
and proven subsea metering technology has allowed the team to reduce
complexity and simplify execution.
At the same time we’ve further optimized the drilling sequence to
increase the production forecast for this project by 10% without changing
the planned start-up date. As a result the expected development cost per
barrel is now more than 25% lower than before.
Focusing on value-driven propositions.
BP Annual Report and Form 20-F 201530