BP 2015 Annual Report Download - page 122
Download and view the complete annual report
Please find page 122 of the 2015 BP annual report below. You can navigate through the pages in the report by either clicking on the pages listed below, or by using the keyword search tool below to find specific information within the annual report.-
 1
1 -
2
-
3
-
4
-
5
-
6
-
7
-
8
-
9
-
10
-
11
-
12
-
13
-
14
-
15
-
16
-
17
-
18
-
19
-
20
-
21
-
22
-
23
-
24
-
25
-
26
-
27
-
28
-
29
-
30
-
31
-
32
-
33
-
34
-
35
-
36
-
37
-
38
-
39
-
40
-
41
-
42
-
43
-
44
-
45
-
46
-
47
-
48
-
49
-
50
-
51
-
52
-
53
-
54
-
55
-
56
-
57
-
58
-
59
-
60
-
61
-
62
-
63
-
64
-
65
-
66
-
67
-
68
-
69
-
70
-
71
-
72
-
73
-
74
-
75
-
76
-
77
-
78
-
79
-
80
-
81
-
82
-
83
-
84
-
85
-
86
-
87
-
88
-
89
-
90
-
91
-
92
-
93
-
94
-
95
-
96
-
97
-
98
-
99
-
100
-
101
-
102
-
103
-
104
-
105
-
106
-
107
-
108
-
109
-
110
-
111
-
 112
112 -
 113
113 -
 114
114 -
 115
115 -
 116
116 -
 117
117 -
 118
118 -
 119
119 -
 120
120 -
 121
121 -
 122
122 -
 123
123 -
 124
124 -
 125
125 -
 126
126 -
 127
127 -
 128
128 -
 129
129 -
 130
130 -
 131
131 -
 132
132 -
133
-
134
-
135
-
136
-
137
-
138
-
139
-
140
-
141
-
142
-
143
-
144
-
145
-
146
-
147
-
148
-
149
-
150
-
151
-
152
-
153
-
154
-
155
-
156
-
157
-
158
-
159
-
160
-
161
-
162
-
163
-
164
-
165
-
166
-
167
-
168
-
169
-
170
-
171
-
172
-
173
-
174
-
175
-
176
-
177
-
178
-
179
-
180
-
181
-
182
-
183
-
184
-
185
-
186
-
187
-
188
-
189
-
190
-
191
-
192
-
193
-
194
-
195
-
196
-
197
-
198
-
199
-
200
-
201
-
202
-
203
-
204
-
205
-
206
-
207
-
208
-
209
-
210
-
211
-
212
-
213
-
214
-
215
-
216
-
217
-
218
-
219
-
220
-
221
-
222
-
223
-
224
-
225
-
226
-
227
-
228
-
229
-
230
-
231
-
232
-
233
-
234
-
235
-
236
-
237
-
238
-
239
-
240
-
241
-
242
-
243
-
244
-
245
-
246
-
247
-
248
-
249
-
250
-
251
-
252
-
253
-
254
-
255
-
256
-
257
-
258
-
259
-
260
-
261
-
262
-
263
-
264
-
265
-
266
 |
 |

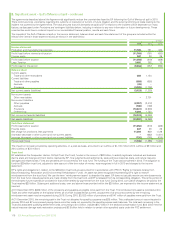
2. Significant event – Gulf of Mexico oil spill – continued
The agreements described above (the Agreements) significantly reduce the uncertainties faced by BP following the Gulf of Mexico oil spill in 2010.
There continues to be uncertainty regarding the outcome or resolution of current or future litigation and the extent and timing of costs relating to the
incident not covered by the Agreements. The total amounts that will ultimately be paid by BP in relation to the incident will be dependent on many
factors, as discussed under Provisions and contingent liabilities below, including in relation to any new information or future developments. These
uncertainties could have a material impact on our consolidated financial position, results and cash flows.
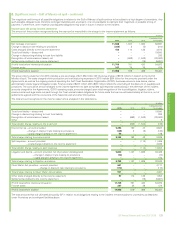
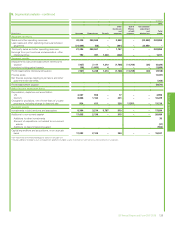
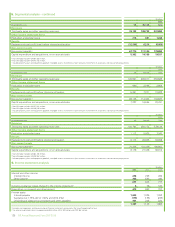
The impacts of the Gulf of Mexico oil spill on the income statement, balance sheet and cash flow statement of the group are included within the
relevant line items in those statements and are shown in the table below.
$ million
2015 2014 2013
Income statement
Production and manufacturing expenses 11,709 781 430
Profit (loss) before interest and taxation (11,709) (781) (430)
Finance costs 247 38 39
Profit (loss) before taxation (11,956) (819) (469)
Less: Taxation 3,492 262 73
Profit (loss) for the period (8,464) (557) (396)
Balance sheet
Current assets
Trade and other receivables 686 1,154
Current liabilities
Trade and other payables (693) (655)
Accruals (40) –
Provisions (3,076) (1,702)
Net current assets (liabilities) (3,123) (1,203)
Non-current assets
Other receivables –2,701
Non-current liabilities
Other payables (2,057) (2,412)
Accruals (186) (169)
Provisions (13,431) (6,903)
Deferred tax 5,200 1,723
Net non-current assets (liabilities) (10,474) (5,060)
Net assets (liabilities) (13,597) (6,263)
Cash flow statement
Profit (loss) before taxation (11,956) (819) (469)
Finance costs 247 38 39
Net charge for provisions, less payments 11,296 939 1,129
(Increase) decrease in other current and non-current assets –(662) (1,481)
Increase (decrease) in other current and non-current liabilities (732) (792) (618)
Pre-tax cash flows (1,145) (1,296) (1,400)
The impact on net cash provided by operating activities, on a post-tax basis, amounted to an outflow of $1,130 million (2014 outflow of $9 million and
2013 outflow of $73 million).
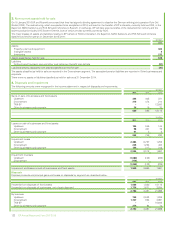
Trust fund
BP established the Deepwater Horizon Oil Spill Trust (the Trust), funded in the amount of $20 billion, to satisfy legitimate individual and business
claims, state and local government claims resolved by BP, final judgments and settlements, state and local response costs, and natural resource
damages and related costs. Fines and penalties are not covered by the trust fund. The funding of the Trust was completed in 2012. The obligation to
fund the $20-billion trust fund, adjusted to take account of the time value of money, was recognized in full in 2010 and charged to the income
statement.
BP’s rights and obligations in relation to the $20-billion trust fund are accounted for in accordance with IFRIC 5 ‘Rights to Interests Arising from
Decommissioning, Restoration and Environmental Rehabilitation Funds’. An asset has been recognized representing BP’s right to receive
reimbursement from the trust fund. We use the term ‘reimbursement asset’ to describe this asset. BP does not actually receive any reimbursements
from the trust fund, instead payments are made directly from the trust fund, and BP is released from its corresponding obligation. This is the portion of
the estimated future expenditure provided for that will be settled by payments from the trust fund. During 2014, cumulative charges to be paid by the
Trust reached $20 billion. Subsequent additional costs, over and above those provided within the $20 billion, are expensed to the income statement as
incurred.
At 31 December 2015, $686 million of the provisions and payables are eligible to be paid from the Trust. The reimbursement asset is recorded within
Trade and other receivables on the balance sheet, all of which is classified as current, as payment of all amounts covered by the remaining
reimbursement asset may be requested during 2016. During 2015, $3,022 million of provisions and $147 million of payables were paid from the Trust.
At 31 December 2015, the remaining cash in the Trust not allocated for specific purposes was $25 million. This unallocated amount was exhausted in
January 2016 and BP commenced paying claims and other costs not covered by the specific-purpose cash balances. The total cash remaining in the
Trust and associated qualifying settlement funds, amounting to $1.4 billion, includes $0.7 billion in the seafood compensation fund, $0.2 billion held for
natural resource damage early restoration projects and $0.5 billion held in relation to certain other specified costs under the PSC settlement.
118 BP Annual Report and Form 20-F 2015