BP 2015 Annual Report Download - page 237
Download and view the complete annual report
Please find page 237 of the 2015 BP annual report below. You can navigate through the pages in the report by either clicking on the pages listed below, or by using the keyword search tool below to find specific information within the annual report.-
 1
1 -
2
-
3
-
4
-
5
-
6
-
7
-
8
-
9
-
10
-
11
-
12
-
13
-
14
-
15
-
16
-
17
-
18
-
19
-
20
-
21
-
22
-
23
-
24
-
25
-
26
-
27
-
28
-
29
-
30
-
31
-
32
-
33
-
34
-
35
-
36
-
37
-
38
-
39
-
40
-
41
-
42
-
43
-
44
-
45
-
46
-
47
-
48
-
49
-
50
-
51
-
52
-
53
-
54
-
55
-
56
-
57
-
58
-
59
-
60
-
61
-
62
-
63
-
64
-
65
-
66
-
67
-
68
-
69
-
70
-
71
-
72
-
73
-
74
-
75
-
76
-
77
-
78
-
79
-
80
-
81
-
82
-
83
-
84
-
85
-
86
-
87
-
88
-
89
-
90
-
91
-
92
-
93
-
94
-
95
-
96
-
97
-
98
-
99
-
100
-
101
-
102
-
103
-
104
-
105
-
106
-
107
-
108
-
109
-
110
-
111
-
112
-
113
-
114
-
115
-
116
-
117
-
118
-
119
-
120
-
121
-
122
-
123
-
124
-
125
-
126
-
127
-
128
-
129
-
130
-
131
-
132
-
133
-
134
-
135
-
136
-
137
-
138
-
139
-
140
-
141
-
142
-
143
-
144
-
145
-
146
-
147
-
148
-
149
-
150
-
151
-
152
-
153
-
154
-
155
-
156
-
157
-
158
-
159
-
160
-
161
-
162
-
163
-
164
-
165
-
166
-
167
-
168
-
169
-
170
-
171
-
172
-
173
-
174
-
175
-
176
-
177
-
178
-
179
-
180
-
181
-
182
-
183
-
184
-
185
-
186
-
187
-
188
-
189
-
190
-
191
-
192
-
193
-
194
-
195
-
196
-
197
-
198
-
199
-
200
-
201
-
202
-
203
-
204
-
205
-
206
-
207
-
208
-
209
-
210
-
211
-
212
-
213
-
214
-
215
-
216
-
217
-
218
-
219
-
220
-
221
-
222
-
223
-
224
-
225
-
226
-
 227
227 -
 228
228 -
 229
229 -
 230
230 -
 231
231 -
 232
232 -
 233
233 -
 234
234 -
 235
235 -
 236
236 -
 237
237 -
 238
238 -
 239
239 -
 240
240 -
 241
241 -
 242
242 -
 243
243 -
 244
244 -
 245
245 -
 246
246 -
 247
247 -
248
-
249
-
250
-
251
-
252
-
253
-
254
-
255
-
256
-
257
-
258
-
259
-
260
-
261
-
262
-
263
-
264
-
265
-
266
 |
 |

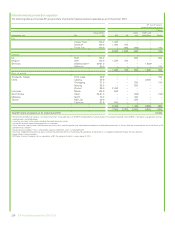
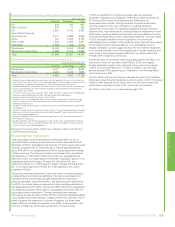
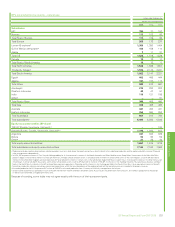
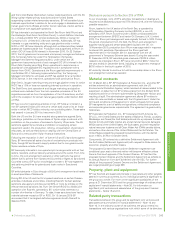
Environmental expenditure
$ million
2015 2014 2013
Environmental expenditure relating to the
Gulf of Mexico oil spill 5,452 190 (66)a
Operating expenditure 521 624 657
Capital expenditure 733 590 1,091
Clean-ups 34 33 42
Additions to environmental remediation
provision 305 371 472
Additions to decommissioning provision 972 2,216 2,092
aThe environmental expenditure credit of $66 million in 2013 arises primarily from the write-back
of a spill response provision.
Environmental expenditure relating to the Gulf of
Mexico oil spill
For full details of all environmental activities in relation to the Gulf of
Mexico oil spill, see Financial statements – Note 2.
Other environmental expenditure
Operating and capital expenditure on the prevention, control, treatment
or elimination of air and water emissions and solid waste is often not
incurred as a separately identifiable transaction. Instead, it forms part of a
larger transaction that includes, for example, normal operations and
maintenance expenditure. The figures for environmental operating and
capital expenditure in the table are therefore estimates, based on the
definitions and guidelines of the American Petroleum Institute.
Environmental operating expenditure of $521 million in 2015 (2014
$624 million) decreased primarily due to Downstream reduced level of
turnaround activity in 2015.
Environmental capital expenditure in 2015 was higher than in 2014,
primarily driven by the installation of a dissolved nitrogen floatation unit at
Whiting refinery’s wastewater treatment plant that is designed to
improve the quality of cleaned water before it leaves the refinery. The
increase also reflects the investment at our Cooper River, US and Geel,
Belgium petrochemicals site to upgrade it to our latest generation PTA
technology that is expected to significantly increase manufacturing
efficiency resulting in lower greenhouse gas emissions and improved
energy efficiency.
Clean-up costs increased to $34 million in 2015 compared with
$33 million in 2014, primarily due to higher remediation management
costs.
In addition to operating and capital expenditures, we also establish
provisions for future environmental remediation. Expenditure against
such provisions normally occurs in subsequent periods and is not
included in environmental operating expenditure reported for such
periods.
Provisions for environmental remediation are made when a clean-up is
probable and the amount of the obligation can be reliably estimated.
Generally, this coincides with the commitment to a formal plan of action
or, if earlier, on divestment or on closure of inactive sites.
The extent and cost of future environmental restoration, remediation and
abatement programmes are inherently difficult to estimate. They often
depend on the extent of contamination, and the associated impact and
timing of the corrective actions required, technological feasibility and
BP’s share of liability. Though the costs of future programmes could be
significant and may be material to the results of operations in the period
in which they are recognized, it is not expected that such costs will be
material to the group’s overall results of operations or financial position.
In 2015 the additions to the environmental provision were lower as 2014
included more new sites and increased provisions from existing sites
resulting from recent acquisitions. The charge for environmental
remediation provisions in 2015 included $6 million in respect of
provisions for new sites (2014 $13 million and 2013 $13 million).
In addition, we make provisions on installation of our oil- and gas-
producing assets and related pipelines to meet the cost of eventual
decommissioning. On installation of an oil or natural gas production
facility, a provision is established that represents the discounted value of
the expected future cost of decommissioning the asset.
In 2015 additions to the decommissioning provision were less than in
2014, and occurred as a result of detailed reviews of expected future
costs. The majority of these additions related to our sites in the North
Sea, the Gulf of Mexico and Angola. The additions in 2013 and 2014
were driven by detailed reviews of expected future costs, increases to
the asset base and for 2013, changes in estimation processes.
We undertake periodic reviews of existing provisions. These reviews
take account of revised cost assumptions, changes in decommissioning
requirements and any technological developments.
Provisions for environmental remediation and decommissioning are
usually established on a discounted basis, as required by IAS 37
‘Provisions, Contingent Liabilities and Contingent Assets’.
Further details of decommissioning and environmental provisions appear
in the financial statements – Note 22.
Regulation of the group’s business
BP’s activities, including its oil and gas exploration and production,
pipelines and transportation, refining and marketing, petrochemicals
production, trading, biofuels, wind and shipping activities, are conducted
in more than 70 countries and are subject to a broad range of EU, US,
international, regional and local legislation and regulations, including
legislation that implements international conventions and protocols.
These cover virtually all aspects of BP’s activities and include matters
such as licence acquisition, production rates, royalties, environmental,
health and safety protection, fuel specifications and transportation,
trading, pricing, anti-trust, export, taxes and foreign exchange.
The terms and conditions of the leases, licences and contracts under
which our oil and gas interests are held vary from country to country.
These leases, licences and contracts are generally granted by or entered
into with a government entity or state-owned or controlled company and
are sometimes entered into with private property owners.
Arrangements with governmental or state entities usually take the form
of licences or production-sharing agreements (PSAs), although
arrangements with the US government can be by lease. Arrangements
with private property owners are usually in the form of leases.
Licences (or concessions) give the holder the right to explore for and
exploit a commercial discovery. Under a licence, the holder bears the
risk of exploration, development and production activities and provides
the financing for these operations. In principle, the licence holder is
entitled to all production, minus any royalties that are payable in kind. A
licence holder is generally required to pay production taxes or royalties,
which may be in cash or in kind. Less typically, BP may explore for and
exploit hydrocarbons under a service agreement with the host entity in
exchange for reimbursement of costs and/or a fee paid in cash rather
than production.
PSAs entered into with a government entity or state-owned or
controlled company generally require BP to provide all the financing and
bear the risk of exploration and production activities in exchange for a
share of the production remaining after royalties, if any.
In certain countries, separate licences are required for exploration and
production activities, and in some cases production licences are limited
to only a portion of the area covered by the original exploration licence.
Both exploration and production licences are generally for a specified
period of time. In the US, leases from the US government typically
remain in effect for a specified term, but may be extended beyond that
term as long as there is production in paying quantities. The term of
BP’s licences and the extent to which these licences may be renewed
vary from country to country.
BP frequently conducts its exploration and production activities in joint
arrangements*or co-ownership arrangements with other international
oil companies, state-owned or controlled companies and/or private
companies. These joint arrangements may be incorporated or
unincorporated arrangements, while the co-ownerships are typically
unincorporated. Whether incorporated or unincorporated, relevant
agreements set out each party’s level of participation or ownership
Additional disclosures
BP Annual Report and Form 20-F 2015 233