BP 2015 Annual Report Download - page 101
Download and view the complete annual report
Please find page 101 of the 2015 BP annual report below. You can navigate through the pages in the report by either clicking on the pages listed below, or by using the keyword search tool below to find specific information within the annual report.-
 1
1 -
2
-
3
-
4
-
5
-
6
-
7
-
8
-
9
-
10
-
11
-
12
-
13
-
14
-
15
-
16
-
17
-
18
-
19
-
20
-
21
-
22
-
23
-
24
-
25
-
26
-
27
-
28
-
29
-
30
-
31
-
32
-
33
-
34
-
35
-
36
-
37
-
38
-
39
-
40
-
41
-
42
-
43
-
44
-
45
-
46
-
47
-
48
-
49
-
50
-
51
-
52
-
53
-
54
-
55
-
56
-
57
-
58
-
59
-
60
-
61
-
62
-
63
-
64
-
65
-
66
-
67
-
68
-
69
-
70
-
71
-
72
-
73
-
74
-
75
-
76
-
77
-
78
-
79
-
80
-
81
-
82
-
83
-
84
-
85
-
86
-
87
-
88
-
89
-
90
-
 91
91 -
 92
92 -
 93
93 -
 94
94 -
 95
95 -
 96
96 -
 97
97 -
 98
98 -
 99
99 -
 100
100 -
 101
101 -
 102
102 -
 103
103 -
 104
104 -
 105
105 -
 106
106 -
 107
107 -
 108
108 -
 109
109 -
 110
110 -
 111
111 -
112
-
113
-
114
-
115
-
116
-
117
-
118
-
119
-
120
-
121
-
122
-
123
-
124
-
125
-
126
-
127
-
128
-
129
-
130
-
131
-
132
-
133
-
134
-
135
-
136
-
137
-
138
-
139
-
140
-
141
-
142
-
143
-
144
-
145
-
146
-
147
-
148
-
149
-
150
-
151
-
152
-
153
-
154
-
155
-
156
-
157
-
158
-
159
-
160
-
161
-
162
-
163
-
164
-
165
-
166
-
167
-
168
-
169
-
170
-
171
-
172
-
173
-
174
-
175
-
176
-
177
-
178
-
179
-
180
-
181
-
182
-
183
-
184
-
185
-
186
-
187
-
188
-
189
-
190
-
191
-
192
-
193
-
194
-
195
-
196
-
197
-
198
-
199
-
200
-
201
-
202
-
203
-
204
-
205
-
206
-
207
-
208
-
209
-
210
-
211
-
212
-
213
-
214
-
215
-
216
-
217
-
218
-
219
-
220
-
221
-
222
-
223
-
224
-
225
-
226
-
227
-
228
-
229
-
230
-
231
-
232
-
233
-
234
-
235
-
236
-
237
-
238
-
239
-
240
-
241
-
242
-
243
-
244
-
245
-
246
-
247
-
248
-
249
-
250
-
251
-
252
-
253
-
254
-
255
-
256
-
257
-
258
-
259
-
260
-
261
-
262
-
263
-
264
-
265
-
266
 |
 |

This page does not form part of BP’s Annual Report on Form 20-F as filed with the SEC.
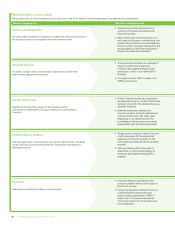
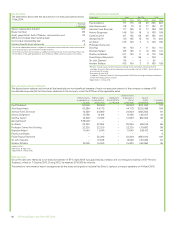
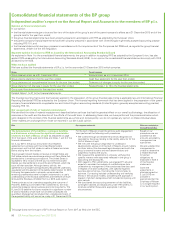
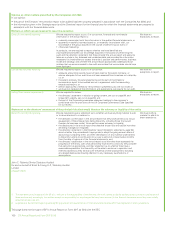
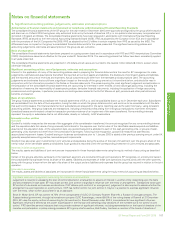
Risk Our response to the risk What we concluded to
the Audit Committee
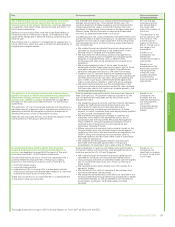
The significant decrease in current and future oil and gas
prices during 2015 and the impact this has had on the
carrying value of the group’s Upstream assets (as described
on page 69 of the report of the audit committee and Note 1 of
the financial statements).
Declines in commodity prices have had a significant effect on
the carrying value of the group’s assets, as evidenced by the
impairments recognized in the 2015 financial statements and in
the prior year.
The principal risk is in relation to management’s assessment of
future cash flows, which are used to project the recoverability of
tangible and intangible assets.
We extended the scope of our original planned procedures to
address the changing risk. This included further use of EY
valuation experts in critically assessing and corroborating the
revised assumptions used in impairment testing, the most
significant of these being future market oil and gas prices and
discount rates. We also focused on reserves and resources
volumes, as described elsewhere in our report.
In addressing this risk, audit procedures were performed by the
component teams at each of the group’s 14 Upstream locations
scoped-in for the audit of asset impairment and by the primary
audit engagement team for the remaining assets identified at
risk of impairment.
•We walked through and tested the controls designed and
operated by the group relating to the assessment of the
carrying value of tangible and intangible assets.
•We examined the methodology used by management to
assess the carrying value of tangible and intangible assets
assigned to cash-generating units, to determine its
compliance with accounting standards and consistency of
application.
•We corroborated estimates of future cash flows and
challenged whether these were appropriate in light of future
price assumptions and the cost budgets. We performed
sensitivity analyses over inputs to the cash flow models.
•Together with EY valuation experts we assessed specific
inputs to the determination of the discount rate, including the
risk-free rate and country risk rates, along with gearing and
cost of debt. Such inputs were benchmarked against risk
rates in international markets in which the group operates.
•We performed procedures over the completeness of the
impairment charge and exploration write-offs, also validating
that base data used in the impairment models agreed to the
underlying books and records.
BP’s oil and gas
price assumptions
are comparable to
the range seen
within the industry at
this time.
The reduction in the
pre-tax discount rate
from 12% to 11%
and the post-tax
discount rate from
8% to 7% are within
the range of our
expectation.
Based on our
procedures, we
believe the
impairment charge is
appropriate.
Based on our
procedures on the
exploration portfolio
we consider the
write-offs were
properly recorded
and remaining
carrying values are
appropriate.
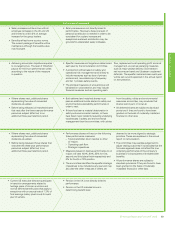
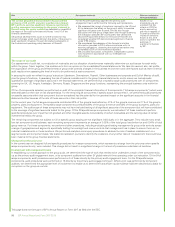
The estimate of oil and gas reserves and resources has a
significant impact on the financial statements, particularly
impairment testing and depreciation, depletion and
amortization (‘DD&A’) charges (as described on page 69 of
the report of the audit committee and Note 1 of the financial
statements).
The estimation of oil and natural gas reserves and resources is a
significant area of judgement due to the technical uncertainty in
assessing quantities and complex contractual arrangements
dictating the group’s share of reportable volumes.
Reserves and resources are also a fundamental indicator of the
future potential of the group’s performance.
Audit procedures were performed by the component teams at
each of the group’s 14 Upstream locations scoped-in for the
audit of reserves and resources and by the primary audit
engagement team.
•We tested the group’s controls over their internal certification
process for technical and commercial experts who are
responsible for reserves and resources estimation.
•We assessed the competence and objectivity of these
experts, to satisfy ourselves they were appropriately qualified
to carry out the volumes estimation.
•We confirmed that significant changes in reserves and
resources were made in the appropriate period, and in
compliance with the Discovered Resources Management
Policy (‘DRM-P’). We gave specific consideration to BP’s
reported share of reserves in joint arrangements and
associates, including Rosneft.
•Where volumetric movements had a material impact on the
financial statements, we validated these volumes against
underlying information and documentation as required by the
DRM-P, along with checking that assumptions used to
estimate reserves and resources were made in compliance
with relevant regulations.
•We validated that the updated reserves and resources
estimates were included appropriately in the group’s
consideration of impairment and in accounting for DD&A.
Based on our
procedures we
consider that the
reserves estimations
are reasonable for
useinthe
impairment testing
and calculation of
DD&A.
Unauthorized trading activity within the integrated
supply & trading function and the potential impact on
revenue (as described on page 69 of the report of the audit
committee and Note 1 of the financial statements).
Unauthorized trading activity is a fraud risk associated with a
potential deliberate misstatement of the group’s trading
positions or mis-marking of positions with an intention to:
•minimize trading losses.
•maximize trading profits.
•understate profits or move profits to subsequent periods
when bonus ceilings have already been reached, to maximize
individual bonuses across financial years.
These acts would lead to an overstatement or understatement
of the group’s revenue and profits.
Audit procedures on revenue and trading were performed by
component teams and the primary audit engagement team at 7
locations across the US, UK and Singapore.
•We walked through and tested the controls designed and
operated by the group over unauthorized trading activity.
•Using analytics software we identified trades with the highest
risk of unauthorized activity so as to focus our testing on
these trades.
•We obtained confirmations directly from third parties for a
sample of trades.
•We verified the fair value of a sample of derivatives using
contract and external market prices.
•We tested the completeness of the amounts recorded in the
financial statements through performing procedures to detect
unrecorded liabilities as well as detailed cut-off procedures
around sales, purchases, trade receivables and trade
payables.
Based on our
procedures we
identified no matters
to report to the Audit
Committee.
BP Annual Report and Form 20-F 2015 97
Financial statements