BP 2015 Annual Report Download - page 84
Download and view the complete annual report
Please find page 84 of the 2015 BP annual report below. You can navigate through the pages in the report by either clicking on the pages listed below, or by using the keyword search tool below to find specific information within the annual report.-
 1
1 -
2
-
3
-
4
-
5
-
6
-
7
-
8
-
9
-
10
-
11
-
12
-
13
-
14
-
15
-
16
-
17
-
18
-
19
-
20
-
21
-
22
-
23
-
24
-
25
-
26
-
27
-
28
-
29
-
30
-
31
-
32
-
33
-
34
-
35
-
36
-
37
-
38
-
39
-
40
-
41
-
42
-
43
-
44
-
45
-
46
-
47
-
48
-
49
-
50
-
51
-
52
-
53
-
54
-
55
-
56
-
57
-
58
-
59
-
60
-
61
-
62
-
63
-
64
-
65
-
66
-
67
-
68
-
69
-
70
-
71
-
72
-
73
-
 74
74 -
 75
75 -
 76
76 -
 77
77 -
 78
78 -
 79
79 -
 80
80 -
 81
81 -
 82
82 -
 83
83 -
 84
84 -
 85
85 -
 86
86 -
 87
87 -
 88
88 -
 89
89 -
 90
90 -
 91
91 -
 92
92 -
 93
93 -
 94
94 -
95
-
96
-
97
-
98
-
99
-
100
-
101
-
102
-
103
-
104
-
105
-
106
-
107
-
108
-
109
-
110
-
111
-
112
-
113
-
114
-
115
-
116
-
117
-
118
-
119
-
120
-
121
-
122
-
123
-
124
-
125
-
126
-
127
-
128
-
129
-
130
-
131
-
132
-
133
-
134
-
135
-
136
-
137
-
138
-
139
-
140
-
141
-
142
-
143
-
144
-
145
-
146
-
147
-
148
-
149
-
150
-
151
-
152
-
153
-
154
-
155
-
156
-
157
-
158
-
159
-
160
-
161
-
162
-
163
-
164
-
165
-
166
-
167
-
168
-
169
-
170
-
171
-
172
-
173
-
174
-
175
-
176
-
177
-
178
-
179
-
180
-
181
-
182
-
183
-
184
-
185
-
186
-
187
-
188
-
189
-
190
-
191
-
192
-
193
-
194
-
195
-
196
-
197
-
198
-
199
-
200
-
201
-
202
-
203
-
204
-
205
-
206
-
207
-
208
-
209
-
210
-
211
-
212
-
213
-
214
-
215
-
216
-
217
-
218
-
219
-
220
-
221
-
222
-
223
-
224
-
225
-
226
-
227
-
228
-
229
-
230
-
231
-
232
-
233
-
234
-
235
-
236
-
237
-
238
-
239
-
240
-
241
-
242
-
243
-
244
-
245
-
246
-
247
-
248
-
249
-
250
-
251
-
252
-
253
-
254
-
255
-
256
-
257
-
258
-
259
-
260
-
261
-
262
-
263
-
264
-
265
-
266
 |
 |

Performance shares
Framework
Performance shares were conditionally awarded to each executive director
in 2013. Maximum awards under the policy were granted representing
five-and-a-half-times salary for Bob Dudley and four-times salary for
Dr Brian Gilvary. Vesting of these awards was subject to delivering targets
set over the three-year performance period.
One third of the award was based on relative total shareholder return
(TSR), one third on operating cash flow and one third on three strategic
imperatives: relative reserves replacement ratio (RRR), safety and
operational risk (S&OR) and major projects delivery, all equally weighted.
Performance against each of these measures was designed to be aligned
with group strategy and key performance indicators (KPIs). Some
measures appear in both the annual cash bonus and performance shares
scorecards as they serve to track in-year performance as well as growth/
improvement over a three-year period.
Relative TSR represents the change in value of a BP shareholding between
the average of the fourth quarter of 2012 and the fourth quarter of 2015
compared to other oil majors (dividends are re-invested). RRR represents
organic reserves added over the three-year performance period divided by
the reserves extracted. This ratio is ranked against like-for-like organic RRR
for other oil major peers.
The 2013-15 comparator group for relative TSR (33.3% weight) and relative
RRR (11.1% weight) was Chevron, ExxonMobil, Shell and Total. The
number of conditional shares that would vest for each of the relative
performance measures for first, second and third place was set at the start
of 2013 and equals 100%, 70% and 35% respectively. This reflects the
approved rules applicable to the 2013-2015 plan. No shares would vest for
fourth or fifth place.
Operating cash flow represented a further one third of the award. BP’s
approved policy specifically states that: operating cash flow has been
identified as a core measure of strategic performance of the company.
Targets reflected agreed plans and normal operating assumptions.
For S&OR, improvement targets were set. For major project delivery, the
committee set a number of projects expected to be delivered over three
years. In reviewing project delivery the committee reviews the cost and
any delays to the original schedule.
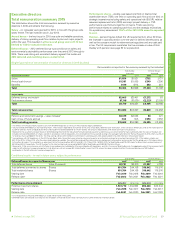
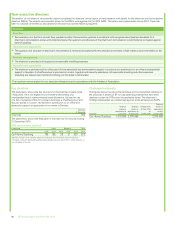
2015 outcomes
The committee considered the performance of the group over the
three-year period of the plan and the specific achievements against
each of the targets set for the measures. The results are summarized in
the table below.
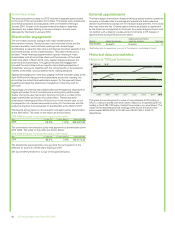
Relative TSR, representing a third of the award, was in third place versus
the comparator group resulting in 35% vesting. Consequently 11.7% of the
overall shares for this measure will vest. The significant weight associated
with this measure aligns the actual value delivered to executive directors
with that to shareholders.
Operating cash flow represented a further one third of the award. In
considering measures and targets for performance share awards BP has
historically adopted a normalized or
‘
like-for-like’ approach reflecting
changes in oil and gas prices. This avoids windfall gains or penal losses in
periods of extreme volatility. The target set in 2013 for 2015 operating cash
flow was $35 billion based on the plan assumptions relating to oil and gas
price and refining margins at that time. This target was reviewed at the
start of 2015 in the light of divestments and plan assumptions relating to
environment, principally oil and gas prices and refining margins. Consistent
with its previous practice the committee normalized the operating cash
flow target. Based on the above assumptions, adjusting for major
divestments and for contributions to the Gulf of Mexico restoration made
in the year, the operating cash flow target was set at $17.7 billion. A scale
comprising threshold and maximum figures was set around the target on a
linear basis. The actual 2015 operating cash flow was $19.1 billion,
equalling the maximum set and resulting in vesting of 33.3% of all shares
for this measure.
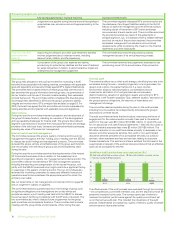
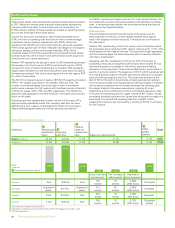
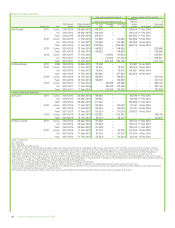
2013-2015 performance shares
Measures Relative total
shareholder
return
Operating
cash flow
Relative
reserves
replacement
ratio Safety and operational risk
Major
project
delivery
Total
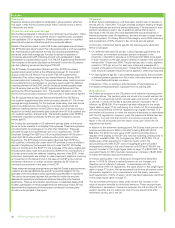
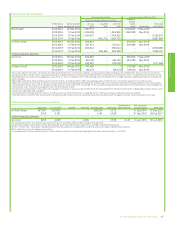
Weight at maximum 33.3% 33.3% 11.1% 11.1% 11.1% 100%
Outcome % 11.7% 33.3% 11.1% 10.4% 11.1% 77.6%
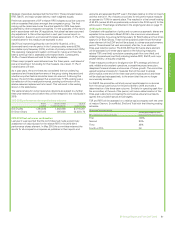
Met
Not met
Group key performance indicator
Loss of primary
containmentb
Tier 1 process
safety events
Recordable
injury frequencyc
Maximum First $19.1bn First 191
events
27
events
0.220/
200k hours 13 projects
Plan/target Outperform
peers $17.7bn Outperform
peers
212
events
30
events
0.240/
200k hours 11 projects
Threshold Third $16.2bn Third 220
events
32
events
0.260/
200k hours 9 projects
Outcome Third $19.1bn Firsta208
events
20
events
0.223/
200k hours
15 projects
started
a This represents a preliminary assessment.
b Adjusted in accordance with the treatment of the LOPC KPI on page 20. Full LOPC is 235.
c RIF excludes biofuels.
33.3%
11.7%11.1%11.1%
3.7%
3.1%3.6%
BP Annual Report and Form 20-F 201580