BP 2015 Annual Report Download - page 157
Download and view the complete annual report
Please find page 157 of the 2015 BP annual report below. You can navigate through the pages in the report by either clicking on the pages listed below, or by using the keyword search tool below to find specific information within the annual report.-
 1
1 -
2
-
3
-
4
-
5
-
6
-
7
-
8
-
9
-
10
-
11
-
12
-
13
-
14
-
15
-
16
-
17
-
18
-
19
-
20
-
21
-
22
-
23
-
24
-
25
-
26
-
27
-
28
-
29
-
30
-
31
-
32
-
33
-
34
-
35
-
36
-
37
-
38
-
39
-
40
-
41
-
42
-
43
-
44
-
45
-
46
-
47
-
48
-
49
-
50
-
51
-
52
-
53
-
54
-
55
-
56
-
57
-
58
-
59
-
60
-
61
-
62
-
63
-
64
-
65
-
66
-
67
-
68
-
69
-
70
-
71
-
72
-
73
-
74
-
75
-
76
-
77
-
78
-
79
-
80
-
81
-
82
-
83
-
84
-
85
-
86
-
87
-
88
-
89
-
90
-
91
-
92
-
93
-
94
-
95
-
96
-
97
-
98
-
99
-
100
-
101
-
102
-
103
-
104
-
105
-
106
-
107
-
108
-
109
-
110
-
111
-
112
-
113
-
114
-
115
-
116
-
117
-
118
-
119
-
120
-
121
-
122
-
123
-
124
-
125
-
126
-
127
-
128
-
129
-
130
-
131
-
132
-
133
-
134
-
135
-
136
-
137
-
138
-
139
-
140
-
141
-
142
-
143
-
144
-
145
-
146
-
 147
147 -
 148
148 -
 149
149 -
 150
150 -
 151
151 -
 152
152 -
 153
153 -
 154
154 -
 155
155 -
 156
156 -
 157
157 -
 158
158 -
 159
159 -
 160
160 -
 161
161 -
 162
162 -
 163
163 -
 164
164 -
 165
165 -
 166
166 -
 167
167 -
168
-
169
-
170
-
171
-
172
-
173
-
174
-
175
-
176
-
177
-
178
-
179
-
180
-
181
-
182
-
183
-
184
-
185
-
186
-
187
-
188
-
189
-
190
-
191
-
192
-
193
-
194
-
195
-
196
-
197
-
198
-
199
-
200
-
201
-
202
-
203
-
204
-
205
-
206
-
207
-
208
-
209
-
210
-
211
-
212
-
213
-
214
-
215
-
216
-
217
-
218
-
219
-
220
-
221
-
222
-
223
-
224
-
225
-
226
-
227
-
228
-
229
-
230
-
231
-
232
-
233
-
234
-
235
-
236
-
237
-
238
-
239
-
240
-
241
-
242
-
243
-
244
-
245
-
246
-
247
-
248
-
249
-
250
-
251
-
252
-
253
-
254
-
255
-
256
-
257
-
258
-
259
-
260
-
261
-
262
-
263
-
264
-
265
-
266
 |
 |

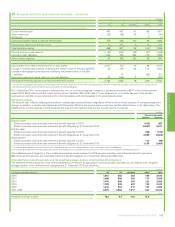
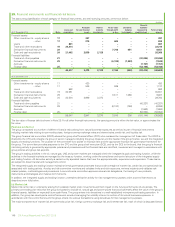
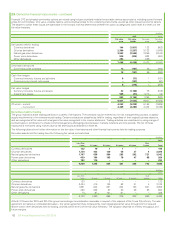
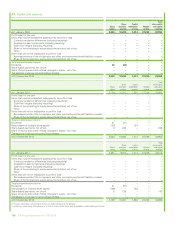
29. Derivative financial instruments – continued
Derivative liabilities held for trading have the following fair values and maturities.
$ million
2015
Less than
1 year 1-2 years 2-3 years 3-4 years 4-5 years
Over
5 years Total
Currency derivatives (499) (2) (2) (347) (79) (882) (1,811)
Oil price derivatives (1,053) (163) (26) (10) (2) (3) (1,257)
Natural gas price derivatives (1,037) (382) (210) (146) (162) (599) (2,536)
Power price derivatives (246) (70) (31) (34) (17) (36) (434)
(2,835) (617) (269) (537) (260) (1,520) (6,038)
$ million
2014
Less than
1 year 1-2 years 2-3 years 3-4 years 4-5 years
Over
5 years Total
Currency derivatives (69) (180) (1) (1) (192) (459) (902)
Oil price derivatives (1,714) (186) (61) (8) (6) (1) (1,976)
Natural gas price derivatives (1,310) (292) (144) (117) (99) (556) (2,518)
Power price derivatives (217) (127) (39) (10) (4) (7) (404)
(3,310) (785) (245) (136) (301) (1,023) (5,800)
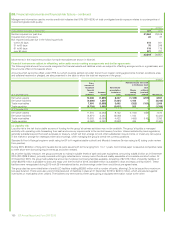
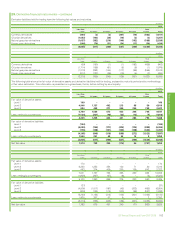
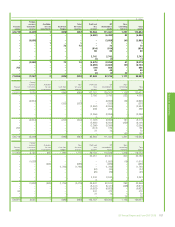
The following table shows the fair value of derivative assets and derivative liabilities held for trading, analysed by maturity period and by methodology
of fair value estimation. This information is presented on a gross basis, that is, before netting by counterparty.
$ million
2015
Less than
1 year 1-2 years 2-3 years 3-4 years 4-5 years
Over
5 years Total
Fair value of derivative assets
Level 1 109–––––109
Level 2 4,946 1,137 402 213 68 50 6,816
Level 3 684 449 271 240 230 748 2,622
5,739 1,586 673 453 298 798 9,547
Less: netting by counterparty (1,530) (231) (49) (32) (12) (5) (1,859)
4,209 1,355 624 421 286 793 7,688
Fair value of derivative liabilities
Level 1 (104) –––––(104)
Level 2 (4,083) (700) (177) (423) (124) (889) (6,396)
Level 3 (178) (148) (141) (146) (148) (636) (1,397)
(4,365) (848) (318) (569) (272) (1,525) (7,897)
Less: netting by counterparty 1,530 231 49 32 12 5 1,859
(2,835) (617) (269) (537) (260) (1,520) (6,038)
Net fair value 1,374 738 355 (116) 26 (727) 1,650
$ million
2014
Less than
1 year 1-2 years 2-3 years 3-4 years 4-5 years
Over
5 years Total
Fair value of derivative assets
Level 1 170 –––––170
Level 2 6,388 1,353 354 130 71 20 8,316
Level 3 483 374 409 255 159 642 2,322
7,041 1,727 763 385 230 662 10,808
Less: netting by counterparty (1,938) (367) (67) (9) – (2) (2,383)
5,103 1,360 696 376 230 660 8,425
Fair value of derivative liabilities
Level 1 (37) –––––(37)
Level 2 (4,905) (1,017) (197) (45) (202) (488) (6,854)
Level 3 (306) (135) (115) (100) (99) (537) (1,292)
(5,248) (1,152) (312) (145) (301) (1,025) (8,183)
Less: netting by counterparty 1,938 367 67 9 – 2 2,383
(3,310) (785) (245) (136) (301) (1,023) (5,800)
Net fair value 1,793 575 451 240 (71) (363) 2,625
BP Annual Report and Form 20-F 2015 153
Financial statements