BP 2015 Annual Report Download - page 183
Download and view the complete annual report
Please find page 183 of the 2015 BP annual report below. You can navigate through the pages in the report by either clicking on the pages listed below, or by using the keyword search tool below to find specific information within the annual report.-
 1
1 -
2
-
3
-
4
-
5
-
6
-
7
-
8
-
9
-
10
-
11
-
12
-
13
-
14
-
15
-
16
-
17
-
18
-
19
-
20
-
21
-
22
-
23
-
24
-
25
-
26
-
27
-
28
-
29
-
30
-
31
-
32
-
33
-
34
-
35
-
36
-
37
-
38
-
39
-
40
-
41
-
42
-
43
-
44
-
45
-
46
-
47
-
48
-
49
-
50
-
51
-
52
-
53
-
54
-
55
-
56
-
57
-
58
-
59
-
60
-
61
-
62
-
63
-
64
-
65
-
66
-
67
-
68
-
69
-
70
-
71
-
72
-
73
-
74
-
75
-
76
-
77
-
78
-
79
-
80
-
81
-
82
-
83
-
84
-
85
-
86
-
87
-
88
-
89
-
90
-
91
-
92
-
93
-
94
-
95
-
96
-
97
-
98
-
99
-
100
-
101
-
102
-
103
-
104
-
105
-
106
-
107
-
108
-
109
-
110
-
111
-
112
-
113
-
114
-
115
-
116
-
117
-
118
-
119
-
120
-
121
-
122
-
123
-
124
-
125
-
126
-
127
-
128
-
129
-
130
-
131
-
132
-
133
-
134
-
135
-
136
-
137
-
138
-
139
-
140
-
141
-
142
-
143
-
144
-
145
-
146
-
147
-
148
-
149
-
150
-
151
-
152
-
153
-
154
-
155
-
156
-
157
-
158
-
159
-
160
-
161
-
162
-
163
-
164
-
165
-
166
-
167
-
168
-
169
-
170
-
171
-
172
-
 173
173 -
 174
174 -
 175
175 -
 176
176 -
 177
177 -
 178
178 -
 179
179 -
 180
180 -
 181
181 -
 182
182 -
 183
183 -
 184
184 -
 185
185 -
 186
186 -
 187
187 -
 188
188 -
 189
189 -
 190
190 -
 191
191 -
 192
192 -
 193
193 -
194
-
195
-
196
-
197
-
198
-
199
-
200
-
201
-
202
-
203
-
204
-
205
-
206
-
207
-
208
-
209
-
210
-
211
-
212
-
213
-
214
-
215
-
216
-
217
-
218
-
219
-
220
-
221
-
222
-
223
-
224
-
225
-
226
-
227
-
228
-
229
-
230
-
231
-
232
-
233
-
234
-
235
-
236
-
237
-
238
-
239
-
240
-
241
-
242
-
243
-
244
-
245
-
246
-
247
-
248
-
249
-
250
-
251
-
252
-
253
-
254
-
255
-
256
-
257
-
258
-
259
-
260
-
261
-
262
-
263
-
264
-
265
-
266
 |
 |

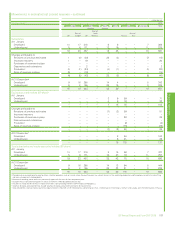
Movements in estimated net proved reserves – continued
billion cubic feet
Natural gasab 2015
Europe North
America
South
America
Africa Asia Australasia Total
UK
Rest of
Europe US
Rest of
North
America Russia
Rest of
Asia
Subsidiaries
At 1 January
Developed 382 300 7,168 17 2,352 901 – 1,688 3,316 16,124
Undeveloped 386 19 2,447 – 6,313 1,597 – 3,892 1,719 16,372
768 318 9,615 17 8,666 2,497 – 5,580 5,035 32,496
Changes attributable to
Revisions of previous estimates (12) 14 (1,120) (13) 132 203 – (165) 13 (948)
Improved recovery 4 – 432 – – 7 – – – 443
Purchases of reserves-in-place – – 65 – 29 554 – – – 648
Discoveries and extensions – – 5 – – 174 – – – 179
Productionc(65) (44) (628) (4) (709) (248) – (157) (297) (2,151)
Sales of reserves-in-place (5) – (6) – (58) (35) – – – (104)
(77) (30) (1,252) (17) (605) 654 – (322) (284) (1,933)
At 31 Decemberd
Developed 348 274 6,257 – 2,071 847 – 1,803 3,408 15,009
Undeveloped 343 14 2,105 – 5,989 2,305 – 3,455 1,343 15,553
691 288 8,363 – 8,060 3,152 – 5,257 4,751 30,563
Equity-accounted entities (BP share)e
At 1 January
Developed – – – 1 1,228 400 4,674 60 – 6,363
Undeveloped – – – 1 717 – 5,111 9 – 5,837
– – – 1 1,945 400 9,785 69 – 12,200
Changes attributable to
Revisions of previous estimates – – – (1) 81 (14) 1,604 (2) – 1,669
Improved recovery –––– 8––– – 8
Purchases of reserves-in-place –––– ––5– – 5
Discoveries and extensions – – – – 209 – 175 – – 384
Productionc– – – – (182) – (430) (19) – (632)
Sales of reserves-in-place – – – – (1) – – – – (1)
– – – (1) 116 (14) 1,354 (21) – 1,434
At 31 Decemberfg
Developed – – – 1 1,463 386 4,962 44 – 6,856
Undeveloped – – – – 598 – 6,176 4 – 6,778
– – – 1 2,061 386 11,139 48 – 13,634
Total subsidiaries and equity-accounted entities (BP share)
At 1 January
Developed 382 300 7,168 18 3,581 1,301 4,674 1,748 3,316 22,487
Undeveloped 386 19 2,447 1 7,030 1,597 5,111 3,901 1,719 22,209
768 318 9,615 18 10,610 2,897 9,785 5,648 5,035 44,695
At 31 December
Developed 348 274 6,257 1 3,534 1,233 4,962 1,847 3,408 21,865
Undeveloped 343 14 2,105 – 6,587 2,305 6,176 3,459 1,343 22,331
691 288 8,363 1 10,121 3,538 11,139 5,305 4,751 44,197
aProved reserves exclude royalties due to others, whether payable in cash or in kind, where the royalty owner has a direct interest in the underlying production and the option and ability to make lifting
and sales arrangements independently.
bBecause of rounding, some totals may not exactly agree with the sum of their component parts.
cIncludes 175 billion cubic feet of natural gas consumed in operations, 146 billion cubic feet in subsidiaries, 29 billion cubic feet in equity-accounted entities.
dIncludes 2,359 billion cubic feet of natural gas in respect of the 30% non-controlling interest in BP Trinidad and Tobago LLC.
eVolumes of equity-accounted entities include volumes of equity-accounted investments of those entities.
fIncludes 129 billion cubic feet of natural gas in respect of the 0.23% non-controlling interest in Rosneft including 5 billion cubic feet held through BP’s equity-accounted interest in Taas-Yuryakh
Neftegazodobycha.
gTotal proved gas reserves held as part of our equity interest in Rosneft is 11,169 billion cubic feet, comprising 1 billion cubic feet in Canada, 13 billion cubic feet in Venezuela, 22 billion cubic feet in
Vietnam and 11,133 billion cubic feet in Russia.
Financial statements
BP Annual Report and Form 20-F 2015 179