BP 2015 Annual Report Download - page 197
Download and view the complete annual report
Please find page 197 of the 2015 BP annual report below. You can navigate through the pages in the report by either clicking on the pages listed below, or by using the keyword search tool below to find specific information within the annual report.-
 1
1 -
2
-
3
-
4
-
5
-
6
-
7
-
8
-
9
-
10
-
11
-
12
-
13
-
14
-
15
-
16
-
17
-
18
-
19
-
20
-
21
-
22
-
23
-
24
-
25
-
26
-
27
-
28
-
29
-
30
-
31
-
32
-
33
-
34
-
35
-
36
-
37
-
38
-
39
-
40
-
41
-
42
-
43
-
44
-
45
-
46
-
47
-
48
-
49
-
50
-
51
-
52
-
53
-
54
-
55
-
56
-
57
-
58
-
59
-
60
-
61
-
62
-
63
-
64
-
65
-
66
-
67
-
68
-
69
-
70
-
71
-
72
-
73
-
74
-
75
-
76
-
77
-
78
-
79
-
80
-
81
-
82
-
83
-
84
-
85
-
86
-
87
-
88
-
89
-
90
-
91
-
92
-
93
-
94
-
95
-
96
-
97
-
98
-
99
-
100
-
101
-
102
-
103
-
104
-
105
-
106
-
107
-
108
-
109
-
110
-
111
-
112
-
113
-
114
-
115
-
116
-
117
-
118
-
119
-
120
-
121
-
122
-
123
-
124
-
125
-
126
-
127
-
128
-
129
-
130
-
131
-
132
-
133
-
134
-
135
-
136
-
137
-
138
-
139
-
140
-
141
-
142
-
143
-
144
-
145
-
146
-
147
-
148
-
149
-
150
-
151
-
152
-
153
-
154
-
155
-
156
-
157
-
158
-
159
-
160
-
161
-
162
-
163
-
164
-
165
-
166
-
167
-
168
-
169
-
170
-
171
-
172
-
173
-
174
-
175
-
176
-
177
-
178
-
179
-
180
-
181
-
182
-
183
-
184
-
185
-
186
-
 187
187 -
 188
188 -
 189
189 -
 190
190 -
 191
191 -
 192
192 -
 193
193 -
 194
194 -
 195
195 -
 196
196 -
 197
197 -
 198
198 -
 199
199 -
 200
200 -
 201
201 -
 202
202 -
 203
203 -
 204
204 -
 205
205 -
 206
206 -
 207
207 -
208
-
209
-
210
-
211
-
212
-
213
-
214
-
215
-
216
-
217
-
218
-
219
-
220
-
221
-
222
-
223
-
224
-
225
-
226
-
227
-
228
-
229
-
230
-
231
-
232
-
233
-
234
-
235
-
236
-
237
-
238
-
239
-
240
-
241
-
242
-
243
-
244
-
245
-
246
-
247
-
248
-
249
-
250
-
251
-
252
-
253
-
254
-
255
-
256
-
257
-
258
-
259
-
260
-
261
-
262
-
263
-
264
-
265
-
266
 |
 |

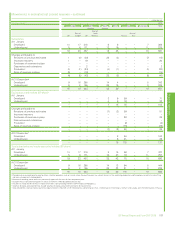
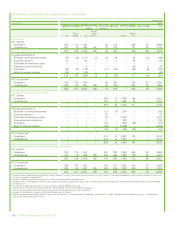
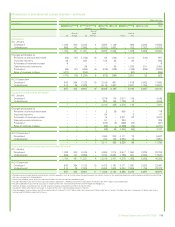
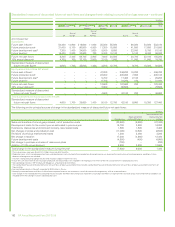
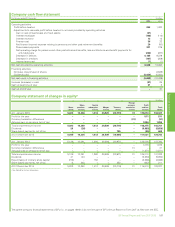
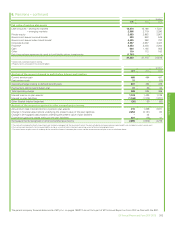
Standardized measure of discounted future net cash flows and changes therein relating to proved oil and gas reserves – continued
$ million
2013
Europe North
America
South
America
Africa Asia Australasia Total
UK
Rest of
Europe US
Rest of
North
America Russia
Rest of
Asia
At 31 December
Subsidiaries
Future cash inflowsa66,200 26,300 234,500 9,400 40,000 67,500 – 89,000 57,600 590,500
Future production costb21,900 11,200 99,000 4,600 11,600 17,800 – 35,000 20,000 221,100
Future development costb6,500 2,000 27,700 2,000 7,600 10,900 – 23,700 6,900 87,300
Future taxationc23,900 8,000 37,000 400 11,100 14,300 – 6,200 8,100 109,000
Future net cash flows 13,900 5,100 70,800 2,400 9,700 24,500 – 24,100 22,600 173,100
10% annual discountd6,800 2,200 34,300 1,900 4,200 9,300 – 13,300 12,800 84,800
Standardized measure of discounted
future net cash flowse7,100 2,900 36,500 500 5,500 15,200 – 10,800 9,800 88,300
Equity-accounted entities (BP share)f
Future cash inflowsa– – – – 45,800 – 255,600 14,300 – 315,700
Future production costb– – – – 22,500 – 139,000 11,800 – 173,300
Future development costb– – – – 6,000 – 19,700 2,100 – 27,800
Future taxationc– – – – 5,900 – 15,200 100 – 21,200
Future net cash flows – – – – 11,400 – 81,700 300 – 93,400
10% annual discountd– – – – 6,900 – 48,700 100 – 55,700
Standardized measure of discounted
future net cash flowsgh – – – – 4,500 – 33,000 200 – 37,700
Total subsidiaries and equity-accounted entities
Standardized measure of discounted
future net cash flows 7,100 2,900 36,500 500 10,000 15,200 33,000 11,000 9,800 126,000
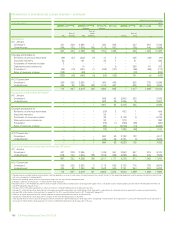
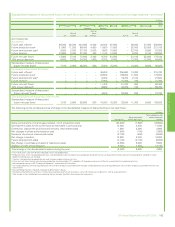
The following are the principal sources of change in the standardized measure of discounted future net cash flows:
$ million
Subsidiaries
Equity-accounted
entities (BP share)
Total subsidiaries and
equity-accounted
entities
Sales and transfers of oil and gas produced, net of production costs (30,600) (7,900) (38,500)
Development costs for the current year as estimated in previous year 14,000 3,200 17,200
Extensions, discoveries and improved recovery, less related costs 1,900 2,000 3,900
Net changes in prices and production cost (1,800) (100) (1,900)
Revisions of previous reserves estimates (3,100) (400) (3,500)
Net change in taxation 12,900 3,400 16,300
Future development costs (4,100) (2,100) (6,200)
Net change in purchase and sales of reserves-in-place (3,500) 9,000 5,500
Addition of 10% annual discount 9,300 2,800 12,100
Total change in the standardized measure during the yeari(5,000) 9,900 4,900
aThe marker prices used were Brent $108.02/bbl, Henry Hub $3.66/mmBtu.
bProduction costs, which include production taxes, and development costs relating to future production of proved reserves are based on the continuation of existing economic conditions. Future
decommissioning costs are included.
cTaxation is computed using appropriate year-end statutory corporate income tax rates.
dFuture net cash flows from oil and natural gas production are discounted at 10% regardless of the group assessment of the risk associated with its producing activities.
eNon-controlling interests in BP Trinidad and Tobago LLC amounted to $1,700 million.
fThe standardized measure of discounted future net cash flows of equity-accounted entities includes standardized measure of discounted future net cash flows of equity-accounted investments of
those entities.
gNon-controlling interests in Rosneft amounted to $200 million in Russia.
hNo equity-accounted future cash flows in Africa because proved reserves are received as a result of contractual arrangements, with no associated costs.
iTotal change in the standardized measure during the year includes the effect of exchange rate movements.
Financial statements
BP Annual Report and Form 20-F 2015 193