BP 2015 Annual Report Download - page 133
Download and view the complete annual report
Please find page 133 of the 2015 BP annual report below. You can navigate through the pages in the report by either clicking on the pages listed below, or by using the keyword search tool below to find specific information within the annual report.-
 1
1 -
2
-
3
-
4
-
5
-
6
-
7
-
8
-
9
-
10
-
11
-
12
-
13
-
14
-
15
-
16
-
17
-
18
-
19
-
20
-
21
-
22
-
23
-
24
-
25
-
26
-
27
-
28
-
29
-
30
-
31
-
32
-
33
-
34
-
35
-
36
-
37
-
38
-
39
-
40
-
41
-
42
-
43
-
44
-
45
-
46
-
47
-
48
-
49
-
50
-
51
-
52
-
53
-
54
-
55
-
56
-
57
-
58
-
59
-
60
-
61
-
62
-
63
-
64
-
65
-
66
-
67
-
68
-
69
-
70
-
71
-
72
-
73
-
74
-
75
-
76
-
77
-
78
-
79
-
80
-
81
-
82
-
83
-
84
-
85
-
86
-
87
-
88
-
89
-
90
-
91
-
92
-
93
-
94
-
95
-
96
-
97
-
98
-
99
-
100
-
101
-
102
-
103
-
104
-
105
-
106
-
107
-
108
-
109
-
110
-
111
-
112
-
113
-
114
-
115
-
116
-
117
-
118
-
119
-
120
-
121
-
122
-
 123
123 -
 124
124 -
 125
125 -
 126
126 -
 127
127 -
 128
128 -
 129
129 -
 130
130 -
 131
131 -
 132
132 -
 133
133 -
 134
134 -
 135
135 -
 136
136 -
 137
137 -
 138
138 -
 139
139 -
 140
140 -
 141
141 -
 142
142 -
 143
143 -
144
-
145
-
146
-
147
-
148
-
149
-
150
-
151
-
152
-
153
-
154
-
155
-
156
-
157
-
158
-
159
-
160
-
161
-
162
-
163
-
164
-
165
-
166
-
167
-
168
-
169
-
170
-
171
-
172
-
173
-
174
-
175
-
176
-
177
-
178
-
179
-
180
-
181
-
182
-
183
-
184
-
185
-
186
-
187
-
188
-
189
-
190
-
191
-
192
-
193
-
194
-
195
-
196
-
197
-
198
-
199
-
200
-
201
-
202
-
203
-
204
-
205
-
206
-
207
-
208
-
209
-
210
-
211
-
212
-
213
-
214
-
215
-
216
-
217
-
218
-
219
-
220
-
221
-
222
-
223
-
224
-
225
-
226
-
227
-
228
-
229
-
230
-
231
-
232
-
233
-
234
-
235
-
236
-
237
-
238
-
239
-
240
-
241
-
242
-
243
-
244
-
245
-
246
-
247
-
248
-
249
-
250
-
251
-
252
-
253
-
254
-
255
-
256
-
257
-
258
-
259
-
260
-
261
-
262
-
263
-
264
-
265
-
266
 |
 |

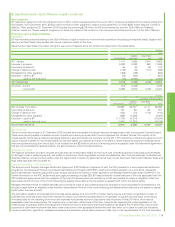
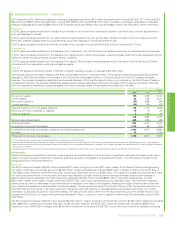
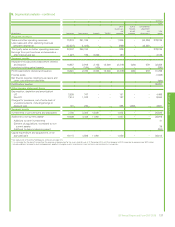
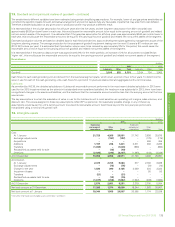
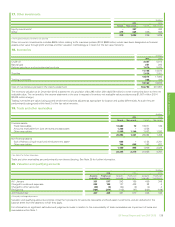
7. Exploration for and evaluation of oil and natural gas resources
The following financial information represents the amounts included within the group totals relating to activity associated with the exploration for and
evaluation of oil and natural gas resources. All such activity is recorded within the Upstream segment.
For information on significant estimates and judgements made in relation to oil and natural gas accounting see Intangible assets within Note 1.
$ million
2015 2014 2013
Exploration and evaluation costs
Exploration expenditure written offa1,829 3,029 2,710
Other exploration costs 524 603 731
Exploration expense for the year 2,353 3,632 3,441
Impairment losses –– 253
Intangible assets – exploration and appraisal expenditure 17,286 19,344 20,865
Liabilities 145 227 212
Net assets 17,141 19,117 20,653
Capital expenditure, on an accruals basis 1,197 2,870 4,464
Net cash used in operating activities 524 603 731
Net cash used in investing activities 1,216 2,786 4,275
a2015 included a $432-million write-off in Libya as there is significant uncertainty about the timing of future drilling operations. It also includes a $345-million write-off relating to the Gila discovery in the
deepwater Gulf of Mexico and a $336-million write-off relating to the Pandora discovery in Angola as development of these prospects is considered challenging. 2014 included a $544-million write-off
relating to disappointing appraisal results of Utica shale in the US Lower 48 and the subsequent decision not to proceed with its development plans, a $524-million write-off relating to the Bourarhat
Sud block licence in the Illizi Basin of Algeria, a $395-million write-off relating to Block KG D6 in India and a $295-million write-off relating to the Moccasin discovery in the deepwater Gulf of Mexico.
2013 included a $845-million write-off relating to the value ascribed to Block BM-CAL-13 offshore Brazil as a result of the Pitanga exploration well not encountering commercial quantities of oil and gas
and a $257-million write-off of costs relating to the Risha concession in Jordan as our exploration activities did not establish the technical basis for a development project in the concession. For further
information see Upstream – Exploration on page 30.
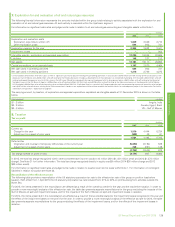
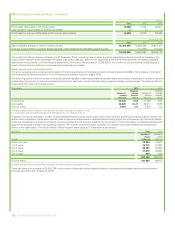
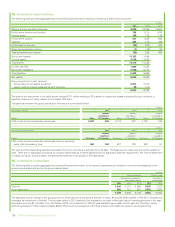
The carrying amount, by location, of exploration and appraisal expenditure capitalized as intangible assets at 31 December 2015 is shown in the table
below.
Carrying amount Location
$1 - 2 billion Angola; India
$2 - 3 billion Canada; Egypt; Brazil
$3 - 4 billion US – Gulf of Mexico
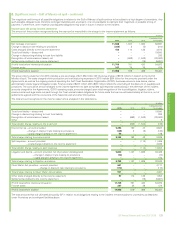
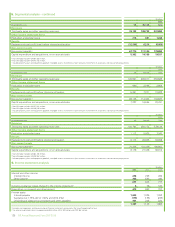
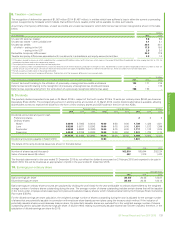
8. Taxation
Tax on profit
$ million
2015 2014 2013
Current tax
Charge for the year 1,910 4,444 5,724
Adjustment in respect of prior years (329) 48 61
1,581 4,492 5,785
Deferred tax
Origination and reversal of temporary differences in the current year (5,090) (3,194) 529
Adjustment in respect of prior years 338 (351) 149
(4,752) (3,545) 678
Tax charge (credit) on profit or loss (3,171) 947 6,463
In 2015, the total tax charge recognized within other comprehensive income was $1,140 million (2014 $1,481 million credit and 2013 $1,374 million
charge). See Note 31 for further information. The total tax charge recognized directly in equity was $9 million (2014 $36 million charge and 2013
$33 million credit).
For information on significant estimates and judgements made in relation to taxation see Income taxes within Note 1. For information on contingent
liabilities in relation to taxation see Note 32.
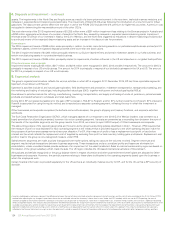
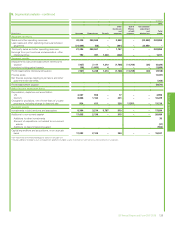
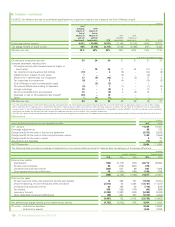
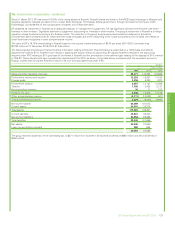
Reconciliation of the effective tax rate
The following table provides a reconciliation of the UK statutory corporation tax rate to the effective tax rate of the group on profit or loss before
taxation. With effect from 1 April 2015 the UK statutory corporation tax rate reduced from 21% to 20% on profits arising from activities outside the
North Sea.
For 2015, the items presented in the reconciliation are affected as a result of the overall tax credit for the year and the loss before taxation. In order to
provide a more meaningful analysis of the effective tax rate, the table also presents separate reconciliations for the group excluding the impacts of the
Gulf of Mexico oil spill and impairment losses, and for the impacts of the Gulf of Mexico oil spill and impairment losses in isolation.
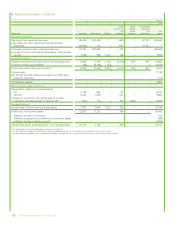
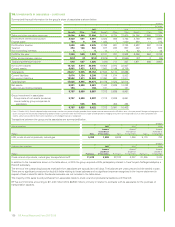
For 2014, the items presented in the reconciliation are affected as a result of the tax credits related to the impairment losses recognized in the year and
the effect of the impairment losses on the profit for the year. In order to provide a more meaningful analysis of the effective tax rate for 2014, the table
also presents separate reconciliations for the group excluding the effects of the impairment losses, and for the effects of the impairment losses in
isolation.
BP Annual Report and Form 20-F 2015 129
Financial statements