BP 2015 Annual Report Download - page 36
Download and view the complete annual report
Please find page 36 of the 2015 BP annual report below. You can navigate through the pages in the report by either clicking on the pages listed below, or by using the keyword search tool below to find specific information within the annual report.-
 1
1 -
2
-
3
-
4
-
5
-
6
-
7
-
8
-
9
-
10
-
11
-
12
-
13
-
14
-
15
-
16
-
17
-
18
-
19
-
20
-
21
-
22
-
23
-
24
-
25
-
 26
26 -
 27
27 -
 28
28 -
 29
29 -
 30
30 -
 31
31 -
 32
32 -
 33
33 -
 34
34 -
 35
35 -
 36
36 -
 37
37 -
 38
38 -
 39
39 -
 40
40 -
 41
41 -
 42
42 -
 43
43 -
 44
44 -
 45
45 -
 46
46 -
47
-
48
-
49
-
50
-
51
-
52
-
53
-
54
-
55
-
56
-
57
-
58
-
59
-
60
-
61
-
62
-
63
-
64
-
65
-
66
-
67
-
68
-
69
-
70
-
71
-
72
-
73
-
74
-
75
-
76
-
77
-
78
-
79
-
80
-
81
-
82
-
83
-
84
-
85
-
86
-
87
-
88
-
89
-
90
-
91
-
92
-
93
-
94
-
95
-
96
-
97
-
98
-
99
-
100
-
101
-
102
-
103
-
104
-
105
-
106
-
107
-
108
-
109
-
110
-
111
-
112
-
113
-
114
-
115
-
116
-
117
-
118
-
119
-
120
-
121
-
122
-
123
-
124
-
125
-
126
-
127
-
128
-
129
-
130
-
131
-
132
-
133
-
134
-
135
-
136
-
137
-
138
-
139
-
140
-
141
-
142
-
143
-
144
-
145
-
146
-
147
-
148
-
149
-
150
-
151
-
152
-
153
-
154
-
155
-
156
-
157
-
158
-
159
-
160
-
161
-
162
-
163
-
164
-
165
-
166
-
167
-
168
-
169
-
170
-
171
-
172
-
173
-
174
-
175
-
176
-
177
-
178
-
179
-
180
-
181
-
182
-
183
-
184
-
185
-
186
-
187
-
188
-
189
-
190
-
191
-
192
-
193
-
194
-
195
-
196
-
197
-
198
-
199
-
200
-
201
-
202
-
203
-
204
-
205
-
206
-
207
-
208
-
209
-
210
-
211
-
212
-
213
-
214
-
215
-
216
-
217
-
218
-
219
-
220
-
221
-
222
-
223
-
224
-
225
-
226
-
227
-
228
-
229
-
230
-
231
-
232
-
233
-
234
-
235
-
236
-
237
-
238
-
239
-
240
-
241
-
242
-
243
-
244
-
245
-
246
-
247
-
248
-
249
-
250
-
251
-
252
-
253
-
254
-
255
-
256
-
257
-
258
-
259
-
260
-
261
-
262
-
263
-
264
-
265
-
266
 |
 |

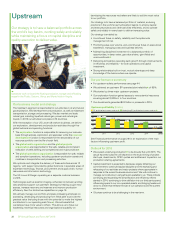
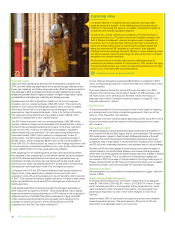
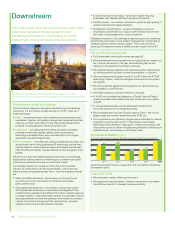
Developments
We achieved three major project start-ups in 2015: two in Angola and
one in Australia. The In Salah Southern Fields project started up in
February 2016. In addition to starting up major projects, we made good
progress in projects in AGT (Azerbaijan, Georgia, Turkey), the North
Sea, Oman and Egypt.
• Azerbaijan, Georgia, Turkey – we signed agreements to become a
shareholder in the Trans Anatolian Natural Gas Pipeline (TANAP), to
transport gas from Shah Deniz to markets in Turkey, Greece, Bulgaria
and Italy.
• North Sea – we continued to see high levels of activity, including
further progress in the major redevelopment of Quad 204 and
approval of the development plans for the Culzean field. We also
completed the Magnus life extension project and installed the
platform topsides at Clair Ridge.
• Oman – development of the Khazzan project continued, with
10 rigs in operation by the end of 2015. We also signed a heads of
agreement with the government of the Sultanate of Oman to extend
the licence area in February 2016.
• Egypt – we signed final agreements on the West Nile Delta project.
We also increased our working interest in both West Nile Delta
concessions.
Subsidiaries development expenditure incurred, excluding midstream
activities, was $13.5 billion (2014 $15.1 billion, 2013 $13.6 billion).
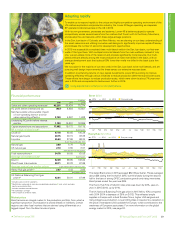
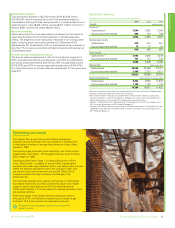
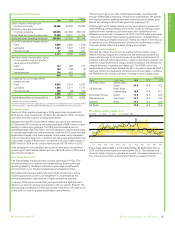
Production
Our oil and natural gas production assets are located onshore and
offshore and include wells, gathering centres, in-field flow lines,
processing facilities, storage facilities, offshore platforms, export
systems (e.g. transit lines), pipelines and LNG plant facilities. These
include production from conventional and unconventional (coalbed
methane and shale) assets. The principal areas of production are
Angola, Argentina, Australia, Azerbaijan, Egypt, Iraq, Trinidad, the UAE,
the UK and the US.
With BP-operated plant reliability increasing from around 86% in 2011
to 95% in 2015, efficient delivery of turnarounds and strong infill drilling
performance, we expect to keep the average managed base decline
through 2016 at around 2% versus our 2014 baseline. Our long-term
expectation for managed base decline remains at the 3-5% per annum
level we have described in the past.
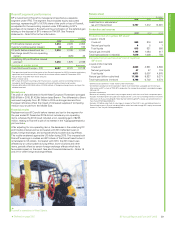
Production (net of royalties)a
2015 2014 2013
Liquids thousand barrels per day
Crude oilb
Subsidiaries 971 844 789
Equity-accounted entitiesc165 163 294
1,1371,007 1,083
Natural gas liquids
Subsidiaries 88 91 86
Equity-accounted entitiesc77 8
95 99 94
Total liquids
Subsidiaries 1,060 936 874
Equity-accounted entitiesc172 170 302
1,2321,106 1,176
Natural gas million cubic feet per day
Subsidiaries 5,495 5,585 5,845
Equity-accounted entitiesc 456 431 415
5,951 6,016 6,259
Total hydrocarbons thousand barrels of oil equivalent per day
Subsidiaries 2,007 1,898 1,882
Equity-accounted entitiesc251245 374
2,2582,143 2,256
a Because of rounding, some totals may not agree exactly with the sum of their component parts.
b Includes condensate and bitumen which are not material.
c Includes BP’s share of production of equity-accounted entities in the Upstream segment.
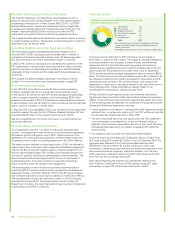
Our Upstream project pipeline
Project Location Type
2015 start-ups
Kizomba Satellites Phase 2 Angola Deepwater
Greater Plutonio Phase 3* Angola Deepwater
Western Flank Phase A Australia LNG
Expected start-ups 2016-2020
Projects currently under construction
Angola LNG Angola LNG
In Amenas compression North Africa Conventional
In Salah Southern FieldsaNorth Africa Conventional
Point Thomson Alaska Conventional
Quad 204* North Sea Conventional
Thunder Horse water injection* Gulf of Mexico Deepwater
Clair Ridge* North Sea Conventional
Juniper Trinidad LNG
Oman Khazzan* Middle East Tight
Persephone Asia Pacific LNG
Thunder Horse South expansion* Gulf of Mexico Deepwater
West Nile Delta Taurus/Libra* Egypt Conventional
Culzean North Sea High pressure
Shah Deniz Stage 2* Azerbaijan Conventional
Taas-Yuryakh expansion Russia Conventional
West Nile Delta Giza/
Fayoum/Raven*
Egypt Conventional
Western Flank Phase B Australia Conventional
Key: Oil Gas
*BP operated
Project Location Type
Expected start-ups 2017-2020
Design and appraisal phase
Angelin Trinidad LNG
Atoll Egypt Conventional
B18 Platina*Angola Deepwater
Mad Dog Phase 2*Gulf of Mexico Deepwater
Snadd*North Sea Conventional
Tangguh expansion*Asia Pacific LNG
Trinidad onshore compression Trinidad LNG
Trinidad offshore compression Trinidad LNG
Vorlich*North Sea Conventional
Beyond 2020
We have an additional 35-40 projects in the pipeline for post-2020
start-up.
• Mix of resource types across conventional oil, deepwater oil,
conventional gas and unconventionals.
• Broad geographic reach.
• Range of development types, from new to producing fields where
we can use existing infrastructure.
a Started up in February 2016.
BP Annual Report and Form 20-F 201532