BP 2015 Annual Report Download - page 222
Download and view the complete annual report
Please find page 222 of the 2015 BP annual report below. You can navigate through the pages in the report by either clicking on the pages listed below, or by using the keyword search tool below to find specific information within the annual report.-
 1
1 -
2
-
3
-
4
-
5
-
6
-
7
-
8
-
9
-
10
-
11
-
12
-
13
-
14
-
15
-
16
-
17
-
18
-
19
-
20
-
21
-
22
-
23
-
24
-
25
-
26
-
27
-
28
-
29
-
30
-
31
-
32
-
33
-
34
-
35
-
36
-
37
-
38
-
39
-
40
-
41
-
42
-
43
-
44
-
45
-
46
-
47
-
48
-
49
-
50
-
51
-
52
-
53
-
54
-
55
-
56
-
57
-
58
-
59
-
60
-
61
-
62
-
63
-
64
-
65
-
66
-
67
-
68
-
69
-
70
-
71
-
72
-
73
-
74
-
75
-
76
-
77
-
78
-
79
-
80
-
81
-
82
-
83
-
84
-
85
-
86
-
87
-
88
-
89
-
90
-
91
-
92
-
93
-
94
-
95
-
96
-
97
-
98
-
99
-
100
-
101
-
102
-
103
-
104
-
105
-
106
-
107
-
108
-
109
-
110
-
111
-
112
-
113
-
114
-
115
-
116
-
117
-
118
-
119
-
120
-
121
-
122
-
123
-
124
-
125
-
126
-
127
-
128
-
129
-
130
-
131
-
132
-
133
-
134
-
135
-
136
-
137
-
138
-
139
-
140
-
141
-
142
-
143
-
144
-
145
-
146
-
147
-
148
-
149
-
150
-
151
-
152
-
153
-
154
-
155
-
156
-
157
-
158
-
159
-
160
-
161
-
162
-
163
-
164
-
165
-
166
-
167
-
168
-
169
-
170
-
171
-
172
-
173
-
174
-
175
-
176
-
177
-
178
-
179
-
180
-
181
-
182
-
183
-
184
-
185
-
186
-
187
-
188
-
189
-
190
-
191
-
192
-
193
-
194
-
195
-
196
-
197
-
198
-
199
-
200
-
201
-
202
-
203
-
204
-
205
-
206
-
207
-
208
-
209
-
210
-
211
-
 212
212 -
 213
213 -
 214
214 -
 215
215 -
 216
216 -
 217
217 -
 218
218 -
 219
219 -
 220
220 -
 221
221 -
 222
222 -
 223
223 -
 224
224 -
 225
225 -
 226
226 -
 227
227 -
 228
228 -
 229
229 -
 230
230 -
 231
231 -
 232
232 -
233
-
234
-
235
-
236
-
237
-
238
-
239
-
240
-
241
-
242
-
243
-
244
-
245
-
246
-
247
-
248
-
249
-
250
-
251
-
252
-
253
-
254
-
255
-
256
-
257
-
258
-
259
-
260
-
261
-
262
-
263
-
264
-
265
-
266
 |
 |

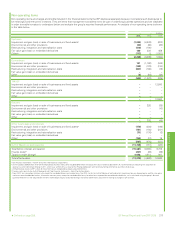
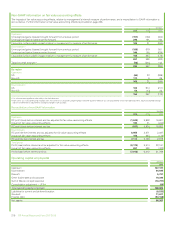
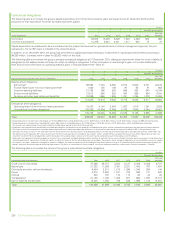
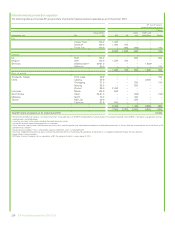
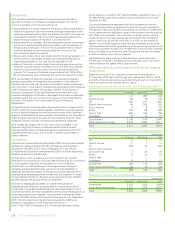
Non-GAAP information on fair value accounting effects
The impacts of fair value accounting effects, relative to management’s internal measure of performance, and a reconciliation to GAAP information is
set out below. Further information on fair value accounting effects is provided on page 256.
$ million
2015 2014 2013
Upstream
Unrecognized gains (losses) brought forward from previous period (191) (160) (404)
Unrecognized (gains) losses carried forward 296 191 160
Favourable (unfavourable) impact relative to management’s measure of performance 105 31 (244)
Downstreama
Unrecognized gains (losses) brought forward from previous period (188) 679 501
Unrecognized (gains) losses carried forward 344 188 (679)
Favourable (unfavourable) impact relative to management’s measure of performance 156 867 (178)
261 898 (422)
Taxation credit (charge) b(56) (341) 142
205 557 (280)
By region
Upstream
US (66) 23 (269)
Non-US 171 825
105 31 (244)
Downstreama
US 102 914 (211)
Non-US 54 (47) 33
156 867 (178)
aFair value accounting effects arise solely in the fuels business.
bFrom 2014, tax is calculated using statutory rates. For 2013 tax is calculated using the group’s discrete quarterly effective tax rate (adjusted for certain non-operating items, equity-accounted earnings
and certain deferred tax adjustments relating to changes in UK taxation).
Reconciliation of non-GAAP information
$ million
2015 2014 2013
Upstream
RC profit (loss) before interest and tax adjusted for fair value accounting effects (1,042) 8,903 16,901
Impact of fair value accounting effects 105 31 (244)
RC profit (loss) before interest and tax (937) 8,934 16,657
Downstream
RC profit before interest and tax adjusted for fair value accounting effects 6,955 2,871 3,097
Impact of fair value accounting effects 156 867 (178)
RC profit before interest and tax 7,111 3,738 2,919
Total group
Profit (loss) before interest and tax adjusted for fair value accounting effects (8,179) 5,514 32,191
Impact of fair value accounting effects 261 898 (422)
Profit (loss) before interest and tax (7,918) 6,412 31,769
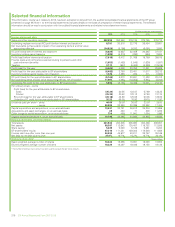
Operating capital employed*
$ million
2015
Upstream 107,197
Downstream 34,935
Rosneft 5,797
Other businesses and corporate 19,399
Gulf of Mexico oil spill response (18,797)
Consolidation adjustment – UPII*(68)
Total operating capital employed 148,463
Liabilities for current and deferred taxation (8,535)
Goodwill 11,627
Finance debt (53,168)
Net assets 98,387
218 BP Annual Report and Form 20-F 2015