BP 2015 Annual Report Download - page 24
Download and view the complete annual report
Please find page 24 of the 2015 BP annual report below. You can navigate through the pages in the report by either clicking on the pages listed below, or by using the keyword search tool below to find specific information within the annual report.-
 1
1 -
2
-
3
-
4
-
5
-
6
-
7
-
8
-
9
-
10
-
11
-
12
-
13
-
 14
14 -
 15
15 -
 16
16 -
 17
17 -
 18
18 -
 19
19 -
 20
20 -
 21
21 -
 22
22 -
 23
23 -
 24
24 -
 25
25 -
 26
26 -
 27
27 -
 28
28 -
 29
29 -
 30
30 -
 31
31 -
 32
32 -
 33
33 -
 34
34 -
35
-
36
-
37
-
38
-
39
-
40
-
41
-
42
-
43
-
44
-
45
-
46
-
47
-
48
-
49
-
50
-
51
-
52
-
53
-
54
-
55
-
56
-
57
-
58
-
59
-
60
-
61
-
62
-
63
-
64
-
65
-
66
-
67
-
68
-
69
-
70
-
71
-
72
-
73
-
74
-
75
-
76
-
77
-
78
-
79
-
80
-
81
-
82
-
83
-
84
-
85
-
86
-
87
-
88
-
89
-
90
-
91
-
92
-
93
-
94
-
95
-
96
-
97
-
98
-
99
-
100
-
101
-
102
-
103
-
104
-
105
-
106
-
107
-
108
-
109
-
110
-
111
-
112
-
113
-
114
-
115
-
116
-
117
-
118
-
119
-
120
-
121
-
122
-
123
-
124
-
125
-
126
-
127
-
128
-
129
-
130
-
131
-
132
-
133
-
134
-
135
-
136
-
137
-
138
-
139
-
140
-
141
-
142
-
143
-
144
-
145
-
146
-
147
-
148
-
149
-
150
-
151
-
152
-
153
-
154
-
155
-
156
-
157
-
158
-
159
-
160
-
161
-
162
-
163
-
164
-
165
-
166
-
167
-
168
-
169
-
170
-
171
-
172
-
173
-
174
-
175
-
176
-
177
-
178
-
179
-
180
-
181
-
182
-
183
-
184
-
185
-
186
-
187
-
188
-
189
-
190
-
191
-
192
-
193
-
194
-
195
-
196
-
197
-
198
-
199
-
200
-
201
-
202
-
203
-
204
-
205
-
206
-
207
-
208
-
209
-
210
-
211
-
212
-
213
-
214
-
215
-
216
-
217
-
218
-
219
-
220
-
221
-
222
-
223
-
224
-
225
-
226
-
227
-
228
-
229
-
230
-
231
-
232
-
233
-
234
-
235
-
236
-
237
-
238
-
239
-
240
-
241
-
242
-
243
-
244
-
245
-
246
-
247
-
248
-
249
-
250
-
251
-
252
-
253
-
254
-
255
-
256
-
257
-
258
-
259
-
260
-
261
-
262
-
263
-
264
-
265
-
266
 |
 |

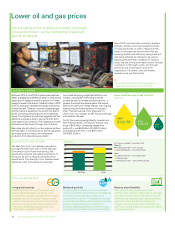
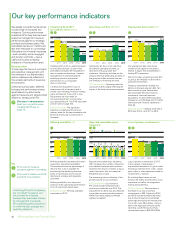
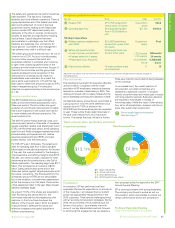
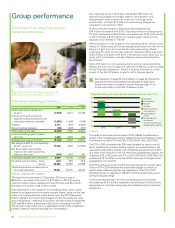
Our key performance indicators
Operating cash flow ($ billion) Gearing (net debt ratio) (%)
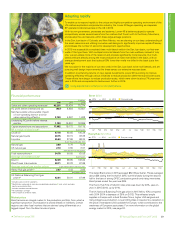
Refining availability (%)
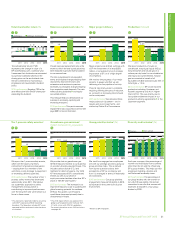
Reported recordable injury frequency
(RIF) measures the number of reported
work-related employee and contractor
incidents that result in a fatality or injury
(apart from minor first aid cases) per
200,000 hours worked.
The measure gives an indication of the
personal safety of our workforce.
2015 performance Our workforce
RIF, which includes employees and
contractors combined, was 0.24. This
improvement on 2014 was also reflected
in our other occupational safety metrics.
While this is encouraging, continued
vigilance is needed.
Loss of primary containment (LOPC)
is the number of unplanned or
uncontrolled releases of oil, gas or other
hazardous materials from a tank, vessel,
pipe, railcar or other equipment used for
containment or transfer.
By tracking these losses we can
monitor the safety and efficiency of our
operations as well as our progress in
making improvements.
2015 performance We have seen a
decrease in our loss of primary
containment to 235. Figures for 2014
and 2015 include increased reporting
due to the introduction of enhanced
automated monitoring for remote sites
in our US Lower 48 business. Using a
like-for-like approach with prior years’
reporting, our 2015 loss of primary
containment figure is 208 (2014 246).
Reported recordable injury
frequencya
Loss of primary containmenta
Underlying RC profit
per ordinary share (cents)
Underlying RC profit is a useful measure
for investors because it is one of the
profitability measures BP management
uses to assess performance. It assists
management in understanding the
underlying trends in operational
performance on a comparable
year-on-year basis.
It reflects the replacement cost of
inventories sold in the period and is
arrived at by excluding inventory holding
gains and losses from profit or loss.
Adjustments are also made for
non-operating items and fair value
accounting effects . The IFRS equivalent
can be found on page 216.
2015 performance The significant
reduction in underlying RC profit per
ordinary share for the year compared with
2014 was mainly due to lower profit in
Upstream.
Operating cash flow is net cash flow
provided by operating activities, as
reported in the group cash flow
statement. Operating activities are the
principal revenue-generating activities of
the group and other activities that are
not investing or financing activities.
2015 performance Operating cash flow
was lower in 2015, largely reflecting the
impact of the lower oil price environment.
Our gearing (net debt ratio) shows
investors how significant net debt is
relative to equity from shareholders in
funding BP’s operations.
We aim to keep our gearing around 20%
to give us the flexibility to deal with an
uncertain environment.
Gearing is calculated by dividing net
debt by total equity plus net debt. Net
debt is equal to gross finance debt,
plus associated derivative financial
instruments, less cash and cash
equivalents. For the nearest equivalent
measure on an IFRS basis and for further
information see Financial statements –
Note 26.
2015 performance Gearing at the end of
2015 was 21.6%, up 4.9% on 2014.
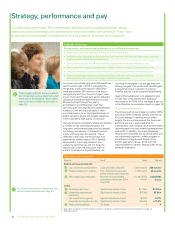
We assess our performance across
a wide range of measures and
indicators. Our key performance
indicators (KPIs) help the board and
executive management measure
performance against our strategic
priorities and business plans. We
periodically review our metrics and
test their relevance to our strategy.
We believe non-financial measures
– such as safety and an engaged
and diverse workforce – have a
useful role to play as leading
indicators of future performance.
Remuneration
To help align the focus of our board
and executive management with
the interests of our shareholders,
certain measures are reflected in
the variable elements of executive
remuneration.
Overall annual bonuses, deferred
bonuses and performance shares
are all based on performance
against measures and targets linked
directly to strategy and KPIs.
Directors’ remuneration
See how our performance
impacted 2015 pay on
page 76.
Underlying RC profit and gearing
are non-GAAP measures, but
are provided for investors
because they are closely tracked
by management to evaluate
BP’s operating performance and
to make financial, strategic and
operating decisions.
2011 2012 2013 2014 2015
1
25
1
00
7
5
5
0
2
5
111.
97
70.92 66.00
32.22
89.70
2011 2012 2013 2014 2015
5
0
4
0
3
0
2
0
1
0
22.2 20.5 21.1
32.8
19.1
2011 2012 2013 2014 2015
2
5
2
0
1
5
1
0
5
18.7
20.4
16.2 16.7
21.6
0.20
2011 2012 2013 2014 2015
0
.80
1.00
0
.60
0
.40
0
.20
Workforce Contractors
0.41
0.43
Employees
0.36
0.31
0.35
0.26
0.31
0.25
0.36
0.31
0.27
0.34
0.24
0.28
2011 2012 2013 2014 2015
5
00
4
00
30
0
2
00
10
0
361
261286
235
292
2011 2012 2013 2014 2015
9
8
9
6
9
4
9
2
9
0
94.8 94.8 95.3 94.9 94.7
Refining availability represents Solomon
Associates’ operational availability.
The measure shows the percentage of
the year that a unit is available for
processing after deducting the time
spent on turnaround activity and all
mechanical, process and regulatory
downtime.
Refining availability is an important
indicator of the operational performance
of our Downstream businesses.
2015 performance Refining availability
was similar to 2014.
Key
KPIs used to measure
progress against our strategy.
KPIs used to determine 2015
and 2016 remuneration.
BP Annual Report and Form 20-F 201520