BP 2015 Annual Report Download - page 35
Download and view the complete annual report
Please find page 35 of the 2015 BP annual report below. You can navigate through the pages in the report by either clicking on the pages listed below, or by using the keyword search tool below to find specific information within the annual report.-
 1
1 -
2
-
3
-
4
-
5
-
6
-
7
-
8
-
9
-
10
-
11
-
12
-
13
-
14
-
15
-
16
-
17
-
18
-
19
-
20
-
21
-
22
-
23
-
24
-
 25
25 -
 26
26 -
 27
27 -
 28
28 -
 29
29 -
 30
30 -
 31
31 -
 32
32 -
 33
33 -
 34
34 -
 35
35 -
 36
36 -
 37
37 -
 38
38 -
 39
39 -
 40
40 -
 41
41 -
 42
42 -
 43
43 -
 44
44 -
 45
45 -
46
-
47
-
48
-
49
-
50
-
51
-
52
-
53
-
54
-
55
-
56
-
57
-
58
-
59
-
60
-
61
-
62
-
63
-
64
-
65
-
66
-
67
-
68
-
69
-
70
-
71
-
72
-
73
-
74
-
75
-
76
-
77
-
78
-
79
-
80
-
81
-
82
-
83
-
84
-
85
-
86
-
87
-
88
-
89
-
90
-
91
-
92
-
93
-
94
-
95
-
96
-
97
-
98
-
99
-
100
-
101
-
102
-
103
-
104
-
105
-
106
-
107
-
108
-
109
-
110
-
111
-
112
-
113
-
114
-
115
-
116
-
117
-
118
-
119
-
120
-
121
-
122
-
123
-
124
-
125
-
126
-
127
-
128
-
129
-
130
-
131
-
132
-
133
-
134
-
135
-
136
-
137
-
138
-
139
-
140
-
141
-
142
-
143
-
144
-
145
-
146
-
147
-
148
-
149
-
150
-
151
-
152
-
153
-
154
-
155
-
156
-
157
-
158
-
159
-
160
-
161
-
162
-
163
-
164
-
165
-
166
-
167
-
168
-
169
-
170
-
171
-
172
-
173
-
174
-
175
-
176
-
177
-
178
-
179
-
180
-
181
-
182
-
183
-
184
-
185
-
186
-
187
-
188
-
189
-
190
-
191
-
192
-
193
-
194
-
195
-
196
-
197
-
198
-
199
-
200
-
201
-
202
-
203
-
204
-
205
-
206
-
207
-
208
-
209
-
210
-
211
-
212
-
213
-
214
-
215
-
216
-
217
-
218
-
219
-
220
-
221
-
222
-
223
-
224
-
225
-
226
-
227
-
228
-
229
-
230
-
231
-
232
-
233
-
234
-
235
-
236
-
237
-
238
-
239
-
240
-
241
-
242
-
243
-
244
-
245
-
246
-
247
-
248
-
249
-
250
-
251
-
252
-
253
-
254
-
255
-
256
-
257
-
258
-
259
-
260
-
261
-
262
-
263
-
264
-
265
-
266
 |
 |

★ Defined on page 256.
Exploration expense
Total exploration expense of $2,353 million (2014 $3,632 million,
2013 $3,441 million) included the write-off of expenses related to
unsuccessful drilling activities, lease expiration or uncertainties around
development in Libya ($432 million), Angola ($471 million), the Gulf of
Mexico ($581 million) and others ($345 million).
Reserves booking
Reserves booking from new discoveries will depend on the results of
ongoing technical and commercial evaluations, including appraisal
drilling. The segment’s total hydrocarbon reserves on an oil equivalent
basis, including equity-accounted entities at 31 December 2015
decreased by 4% (a decrease of 5% for subsidiaries and an increase of
less than 1% for equity-accounted entities) compared with reserves at
31 December 2014.
Proved reserves replacement ratio★
The proved reserves replacement ratio for the Upstream segment in
2015, excluding acquisitions and disposals, was 33% for subsidiaries
and equity-accounted entities (2014 31%), 28% for subsidiaries alone
(2014 29%) and 76% for equity-accounted entities alone (2014 43%).
For more information on proved reserves replacement for the group see
page 227.
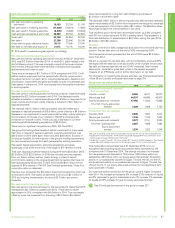
Upstream reserves
Estimated net proved reservesa (net of royalties)
2015 2014 2013
Liquids million barrels
Crude oilb
Subsidiaries 3,560 3,582 3,798
Equity-accounted entitiesc694702 729
4,2544,283 4,527
Natural gas liquids
Subsidiaries 422 510 551
Equity-accounted entitiesc13 16 16
435 526 567
Total liquids
Subsidiariesd3,982 4,092 4,349
Equity-accounted entitiesc707717 745
4,689 4,809 5,094
Natural gas billion cubic feet
Subsidiariese 30,563 32,496 34,187
Equity-accounted entitiesc 2,465 2,373 2,517
33,027 34,869 36,704
Total hydrocarbons million barrels of oil equivalent
Subsidiaries 9,252 9,694 10,243
Equity-accounted entitiesc1,1321,126 1,179
10,38410,821 11,422
a Because of rounding, some totals may not agree exactly with the sum of their component parts.
b Includes condensate and bitumen which are not material.
c BP’s share of reserves of equity-accounted entities in the Upstream segment. During 2015,
upstream operations in Abu Dhabi, Argentina and Bolivia, as well as some of our operations in
Angola and Indonesia, were conducted through equity-accounted entities.
d Includes 19 million barrels (21 million barrels at 31 December 2014 and 2013) in respect of the
30% non-controlling interest in BP Trinidad & Tobago LLC.
e Includes 2,359 billion cubic feet of natural gas (2,519 billion cubic feet at 31 December 2014 and
2,685 billion cubic feet at 31 December 2013) in respect of the 30% non-controlling interest in
BP Trinidad & Tobago LLC.
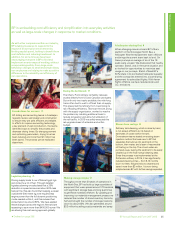
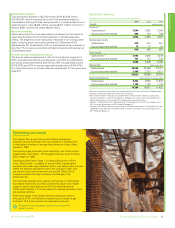
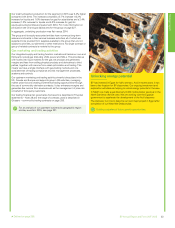
Optimizing our assets
The Caspian Sea is one of the world’s leading hydrocarbon
provinces and we have been the major presence in development
of Azerbaijan’s offshore oil and gas fields since our office in Baku
opened in 1992.
The country’s gas production is dominated by one of the world’s
largest fields, Shah Deniz – BP’s biggest discovery since Prudhoe
Bay in Alaska in 1968.
Developing Shah Deniz Stage 1 involved drilling some of BP’s
most difficult wells – at depths of around 6,000 metres below
sea level and under high pressures. And in only seven years, we also
drilled the deepest exploration well in the Caspian to date, built
the platform and onshore terminal and laid the 700km South
Caucasus pipeline through Azerbaijan and Georgia to the
Turkish border.
Our technical expertise and ongoing maintenance of the facilities
has helped Shah Deniz provide a consistently secure and reliable
supply of gas to the region and in 2015 we achieved almost
100% plant reliability . This has helped to increase production from
the existing facilities.
Shah Deniz Stage 1 has reliably delivered plateau production
throughout 2015, with 9.9 billion standard cubic metres of gas
and about 18.3 million barrels of condensate produced.
Strengthening our assets to provide momentum for
years to come.
BP Annual Report and Form 20-F 2015 31
Strategic report