BP 2015 Annual Report Download - page 37
Download and view the complete annual report
Please find page 37 of the 2015 BP annual report below. You can navigate through the pages in the report by either clicking on the pages listed below, or by using the keyword search tool below to find specific information within the annual report.-
 1
1 -
2
-
3
-
4
-
5
-
6
-
7
-
8
-
9
-
10
-
11
-
12
-
13
-
14
-
15
-
16
-
17
-
18
-
19
-
20
-
21
-
22
-
23
-
24
-
25
-
26
-
 27
27 -
 28
28 -
 29
29 -
 30
30 -
 31
31 -
 32
32 -
 33
33 -
 34
34 -
 35
35 -
 36
36 -
 37
37 -
 38
38 -
 39
39 -
 40
40 -
 41
41 -
 42
42 -
 43
43 -
 44
44 -
 45
45 -
 46
46 -
 47
47 -
48
-
49
-
50
-
51
-
52
-
53
-
54
-
55
-
56
-
57
-
58
-
59
-
60
-
61
-
62
-
63
-
64
-
65
-
66
-
67
-
68
-
69
-
70
-
71
-
72
-
73
-
74
-
75
-
76
-
77
-
78
-
79
-
80
-
81
-
82
-
83
-
84
-
85
-
86
-
87
-
88
-
89
-
90
-
91
-
92
-
93
-
94
-
95
-
96
-
97
-
98
-
99
-
100
-
101
-
102
-
103
-
104
-
105
-
106
-
107
-
108
-
109
-
110
-
111
-
112
-
113
-
114
-
115
-
116
-
117
-
118
-
119
-
120
-
121
-
122
-
123
-
124
-
125
-
126
-
127
-
128
-
129
-
130
-
131
-
132
-
133
-
134
-
135
-
136
-
137
-
138
-
139
-
140
-
141
-
142
-
143
-
144
-
145
-
146
-
147
-
148
-
149
-
150
-
151
-
152
-
153
-
154
-
155
-
156
-
157
-
158
-
159
-
160
-
161
-
162
-
163
-
164
-
165
-
166
-
167
-
168
-
169
-
170
-
171
-
172
-
173
-
174
-
175
-
176
-
177
-
178
-
179
-
180
-
181
-
182
-
183
-
184
-
185
-
186
-
187
-
188
-
189
-
190
-
191
-
192
-
193
-
194
-
195
-
196
-
197
-
198
-
199
-
200
-
201
-
202
-
203
-
204
-
205
-
206
-
207
-
208
-
209
-
210
-
211
-
212
-
213
-
214
-
215
-
216
-
217
-
218
-
219
-
220
-
221
-
222
-
223
-
224
-
225
-
226
-
227
-
228
-
229
-
230
-
231
-
232
-
233
-
234
-
235
-
236
-
237
-
238
-
239
-
240
-
241
-
242
-
243
-
244
-
245
-
246
-
247
-
248
-
249
-
250
-
251
-
252
-
253
-
254
-
255
-
256
-
257
-
258
-
259
-
260
-
261
-
262
-
263
-
264
-
265
-
266
 |
 |

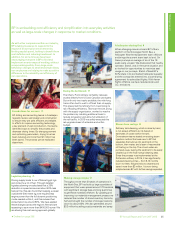
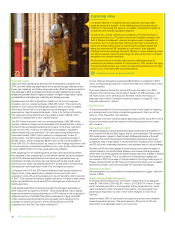
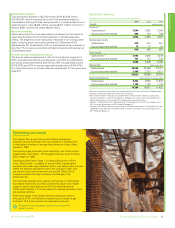
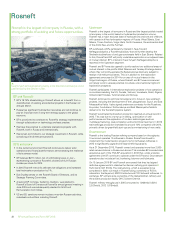
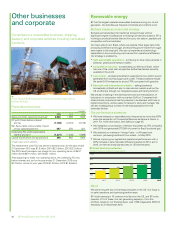
Unlocking energy potential
BP has invested in Egypt for half a century. And in recent years, it has
been a key location for BP discoveries. Our ongoing investment and
exploration activities are helping to unlock energy potential in the area.
In March we made a gas discovery 6,400 metres below sea level in the
North Damietta offshore area. We are working with the Egyptian
government to accelerate the development of the Atoll discovery.
The discovery is in line to become our next major project in Egypt after
completion of our West Nile Delta project.
Building a pipeline of future growth opportunities.
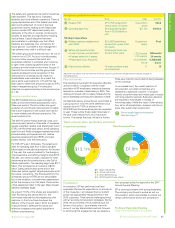
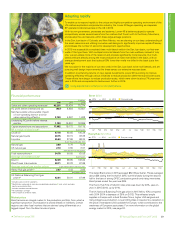
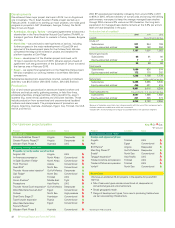
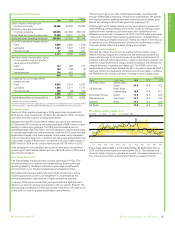
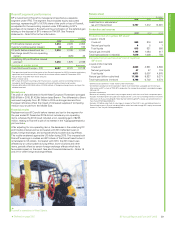
Our total hydrocarbon production for the segment in 2015 was 5.4% higher
compared with 2014. The increase comprised a 5.7% increase (13.2%
increase for liquids and 1.6% decrease for gas) for subsidiaries and a 2.4%
increase (1.2% increase for liquids and 5.8% increase for gas) for
equity-accounted entities compared with 2014. For more information on
production see Oil and gas disclosures for the group on page 227.
In aggregate, underlying production was flat versus 2014.
The group and its equity-accounted entities have numerous long-term
sales commitments in their various business activities, all of which are
expected to be sourced from supplies available to the group that are not
subject to priorities, curtailments or other restrictions. No single contract or
group of related contracts is material to the group.
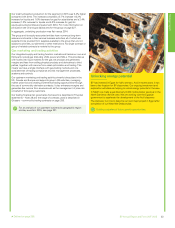
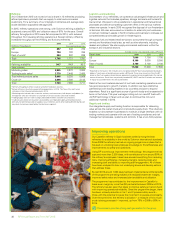
Gas marketing and trading activities
Our integrated supply and trading function markets and trades our own and
third-party natural gas (including LNG), power and NGLs. This provides us
with routes into liquid markets for the gas we produce and generates
margins and fees from selling physical products and derivatives to third
parties, together with income from asset optimization and trading. This
means we have a single interface with gas trading markets and one
consistent set of trading compliance and risk management processes,
systems and controls.
Our upstream marketing and trading activity primarily takes place in the
US, Canada and Europe and supports group LNG activities, managing
market price risk and creating incremental trading opportunities through
the use of commodity derivative contracts. It also enhances margins and
generates fee income from sources such as the management of price risk
on behalf of third-party customers.
Our trading financial risk governance framework is described in Financial
statements – Note 28 and the range of contracts used is described in
Glossary – commodity trading contracts on page 256.
For an analysis of our upstream business by geographic region
and key events in 2015, see page 221.
★ Defined on page 256.BP Annual Report and Form 20-F 2015 33
Strategic report