BP 2015 Annual Report Download - page 204
Download and view the complete annual report
Please find page 204 of the 2015 BP annual report below. You can navigate through the pages in the report by either clicking on the pages listed below, or by using the keyword search tool below to find specific information within the annual report.-
 1
1 -
2
-
3
-
4
-
5
-
6
-
7
-
8
-
9
-
10
-
11
-
12
-
13
-
14
-
15
-
16
-
17
-
18
-
19
-
20
-
21
-
22
-
23
-
24
-
25
-
26
-
27
-
28
-
29
-
30
-
31
-
32
-
33
-
34
-
35
-
36
-
37
-
38
-
39
-
40
-
41
-
42
-
43
-
44
-
45
-
46
-
47
-
48
-
49
-
50
-
51
-
52
-
53
-
54
-
55
-
56
-
57
-
58
-
59
-
60
-
61
-
62
-
63
-
64
-
65
-
66
-
67
-
68
-
69
-
70
-
71
-
72
-
73
-
74
-
75
-
76
-
77
-
78
-
79
-
80
-
81
-
82
-
83
-
84
-
85
-
86
-
87
-
88
-
89
-
90
-
91
-
92
-
93
-
94
-
95
-
96
-
97
-
98
-
99
-
100
-
101
-
102
-
103
-
104
-
105
-
106
-
107
-
108
-
109
-
110
-
111
-
112
-
113
-
114
-
115
-
116
-
117
-
118
-
119
-
120
-
121
-
122
-
123
-
124
-
125
-
126
-
127
-
128
-
129
-
130
-
131
-
132
-
133
-
134
-
135
-
136
-
137
-
138
-
139
-
140
-
141
-
142
-
143
-
144
-
145
-
146
-
147
-
148
-
149
-
150
-
151
-
152
-
153
-
154
-
155
-
156
-
157
-
158
-
159
-
160
-
161
-
162
-
163
-
164
-
165
-
166
-
167
-
168
-
169
-
170
-
171
-
172
-
173
-
174
-
175
-
176
-
177
-
178
-
179
-
180
-
181
-
182
-
183
-
184
-
185
-
186
-
187
-
188
-
189
-
190
-
191
-
192
-
193
-
 194
194 -
 195
195 -
 196
196 -
 197
197 -
 198
198 -
 199
199 -
 200
200 -
 201
201 -
 202
202 -
 203
203 -
 204
204 -
 205
205 -
 206
206 -
 207
207 -
 208
208 -
 209
209 -
 210
210 -
 211
211 -
 212
212 -
 213
213 -
 214
214 -
215
-
216
-
217
-
218
-
219
-
220
-
221
-
222
-
223
-
224
-
225
-
226
-
227
-
228
-
229
-
230
-
231
-
232
-
233
-
234
-
235
-
236
-
237
-
238
-
239
-
240
-
241
-
242
-
243
-
244
-
245
-
246
-
247
-
248
-
249
-
250
-
251
-
252
-
253
-
254
-
255
-
256
-
257
-
258
-
259
-
260
-
261
-
262
-
263
-
264
-
265
-
266
 |
 |

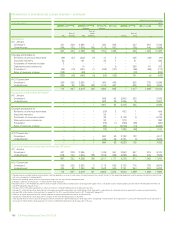
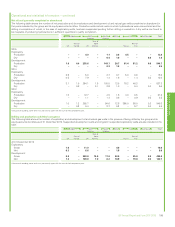
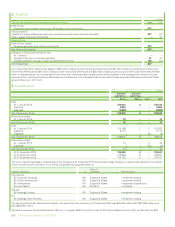
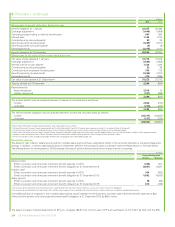
2. Taxation
$ million
Tax charge included in total comprehensive income 2015 2014
Deferred tax
Origination and reversal of temporary differences in the current year 877 –
This comprises:
Taxable temporary differences relating to pensions and other post-retirement benefits 877 (41)
Other taxable temporary differences –41
Deferred tax
Deferred tax liability
Pensions and other post-retirement benefits 877 –
Net deferred tax liability 877 –
Analysis of movements during the year
At 1 January ––
Charge for the year on ordinary activities 81 41
Charge (credit) for the year in other comprehensive income 796 (41)
At 31 December 877 –
At 31 December 2015, deferred tax assets of $65 million relating to other temporary differences and $8 million relating to pensions and other post-
retirement benefits (2014 $95 million relating to other temporary differences and $25 million relating to pensions and other post-retirement benefits)
were not recognized as it is not considered more likely than not that suitable taxable profits will be available in the company from which the future
reversal of the underlying temporary differences can be deducted. It is anticipated that the reversal of these temporary differences will benefit other
group companies in the future.
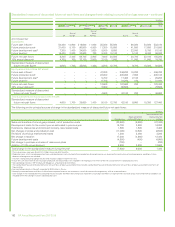
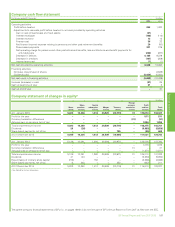
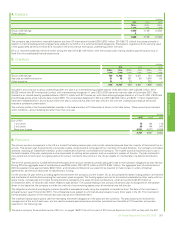
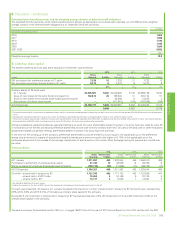
3. Investments
$ million
Subsidiary
undertakings
Associated
undertakings
Shares Shares Loans Total
Cost
At 1 January 2015 139,313 2 – 139,315
Additions 2,800 – – 2,800
Disposals (2,800) – – (2,800)
At 31 December 2015 139,313 2 – 139,315
Amounts provided
At 1 January 2015 74 – – 74
At 31 December 2015 74 – – 74
Cost
At 1 January 2014 134,199 2 2 134,203
Additions 5,114 – – 5,114
Disposals – – (2) (2)
At 31 December 2014 139,313 2 – 139,315
Amounts provided
At 1 January 2014 74 – 2 76
Disposals – – (2) (2)
At 31 December 2014 74 – – 74
At 31 December 2015 139,239 2 – 139,241
At 31 December 2014 139,239 2 – 139,241
At 31 December 2013 134,125 2 – 134,127
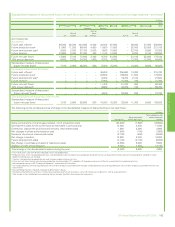
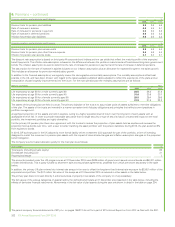
The more important subsidiary undertakings of the company at 31 December 2015 and the percentage holding of ordinary share capital (to the nearest
whole number) are set out below. For a full list of significant holdings see Note 15.
Subsidiary undertakings %
Country of
incorporation Principal activities
International
BP Corporate Holdings 100 England & Wales Investment holding
BP Global Investments 100 England & Wales Investment holding
BP International 100 England & Wales Integrated oil operations
Burmah Castrol 100 Scotland Lubricants
Canada
BP Holdings Canada 100 England & Wales Investment holding
US
BP Holdings North America 100 England & Wales Investment holding
The carrying value of BP International Limited in the accounts of the company at 31 December 2015 was $70,425 million (2014 $67,625 million and
2013 $62,625 million).
The parent company financial statements of BP p.l.c. on pages 196-213 do not form part of BP’s Annual Report on Form 20-F as filed with the SEC.
200 BP Annual Report and Form 20-F 2015