BP 2015 Annual Report Download - page 44
Download and view the complete annual report
Please find page 44 of the 2015 BP annual report below. You can navigate through the pages in the report by either clicking on the pages listed below, or by using the keyword search tool below to find specific information within the annual report.-
 1
1 -
2
-
3
-
4
-
5
-
6
-
7
-
8
-
9
-
10
-
11
-
12
-
13
-
14
-
15
-
16
-
17
-
18
-
19
-
20
-
21
-
22
-
23
-
24
-
25
-
26
-
27
-
28
-
29
-
30
-
31
-
32
-
33
-
 34
34 -
 35
35 -
 36
36 -
 37
37 -
 38
38 -
 39
39 -
 40
40 -
 41
41 -
 42
42 -
 43
43 -
 44
44 -
 45
45 -
 46
46 -
 47
47 -
 48
48 -
 49
49 -
 50
50 -
 51
51 -
 52
52 -
 53
53 -
 54
54 -
55
-
56
-
57
-
58
-
59
-
60
-
61
-
62
-
63
-
64
-
65
-
66
-
67
-
68
-
69
-
70
-
71
-
72
-
73
-
74
-
75
-
76
-
77
-
78
-
79
-
80
-
81
-
82
-
83
-
84
-
85
-
86
-
87
-
88
-
89
-
90
-
91
-
92
-
93
-
94
-
95
-
96
-
97
-
98
-
99
-
100
-
101
-
102
-
103
-
104
-
105
-
106
-
107
-
108
-
109
-
110
-
111
-
112
-
113
-
114
-
115
-
116
-
117
-
118
-
119
-
120
-
121
-
122
-
123
-
124
-
125
-
126
-
127
-
128
-
129
-
130
-
131
-
132
-
133
-
134
-
135
-
136
-
137
-
138
-
139
-
140
-
141
-
142
-
143
-
144
-
145
-
146
-
147
-
148
-
149
-
150
-
151
-
152
-
153
-
154
-
155
-
156
-
157
-
158
-
159
-
160
-
161
-
162
-
163
-
164
-
165
-
166
-
167
-
168
-
169
-
170
-
171
-
172
-
173
-
174
-
175
-
176
-
177
-
178
-
179
-
180
-
181
-
182
-
183
-
184
-
185
-
186
-
187
-
188
-
189
-
190
-
191
-
192
-
193
-
194
-
195
-
196
-
197
-
198
-
199
-
200
-
201
-
202
-
203
-
204
-
205
-
206
-
207
-
208
-
209
-
210
-
211
-
212
-
213
-
214
-
215
-
216
-
217
-
218
-
219
-
220
-
221
-
222
-
223
-
224
-
225
-
226
-
227
-
228
-
229
-
230
-
231
-
232
-
233
-
234
-
235
-
236
-
237
-
238
-
239
-
240
-
241
-
242
-
243
-
244
-
245
-
246
-
247
-
248
-
249
-
250
-
251
-
252
-
253
-
254
-
255
-
256
-
257
-
258
-
259
-
260
-
261
-
262
-
263
-
264
-
265
-
266
 |
 |

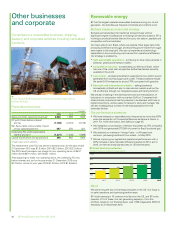
Other businesses
and corporate
Financial performance
$ million
2015 2014 2013
Sales and other operating revenuesa2,048 1,989 1,805
RC profit (loss) before interest
and tax (1,768) (2,010) (2,319)
Net (favourable) unfavourable impact
of non-operating items 547 670 421
Underlying RC profit (loss) before
interest and tax (1,221) (1,340) (1,898)
Capital expenditure and acquisitions 340 903 1,050
a
Includes sales to other segments.
The replacement cost (RC) loss before interest and tax for the year ended
31 December 2015 was $1.8 billion (2014 $2.0 billion, 2013 $2.3 billion).
The 2015 result included a net charge for non-operating items of $547
million (2014 $670 million, 2013 $421 million).
After adjusting for these non-operating items, the underlying RC loss
before interest and tax for the year ended 31 December 2015 was
$1.2 billion, similar to prior year (2014 $1.3 billion, 2013 $1.9 billion).
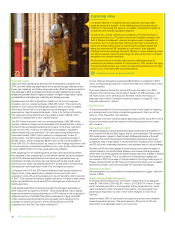
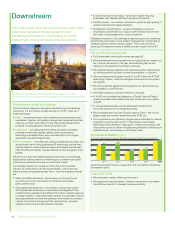
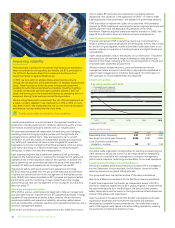
At our Tropical BioEnergia plant in Brazil we process sugar cane to
produce biofuels.
Comprises our renewables business, shipping,
treasury and corporate activities including centralized
functions.
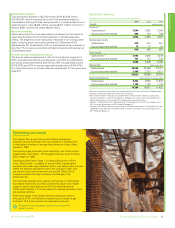
Renewable energy
BP has the largest operated renewables business among our oil and
gas peers. Our activities are focused on biofuels and onshore wind.
Biofuels business model and strategy
Biofuels can be blended into traditional transport fuels without
significant engine modifications to existing fuel-delivery systems. BP is
working to produce biofuels that are low cost, low carbon, scalable and
competitive without subsidies.
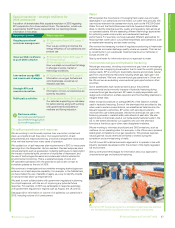
Our main activity is in Brazil, where we operate three sugar cane mills
producing bioethanol and sugar, and exporting power made from sugar
cane waste to the local grid. We use our expertise and technology
capabilities to drive continuing improvements in operational efficiency.
Our strategy is enabled by:
• Safe and reliable operations – continuing to drive improvements in
personal, process and transport safety.
• Competitive sourcing – concentrating our efforts in Brazil, which
has one of the most cost-competitive biofuel feedstocks currently
available in the world.
• Low carbon – producing bioethanol supported by low-carbon power
generated from burning sugar cane waste. These processes reduce
life-cycle GHG emissions by around 70% compared with gasoline.
• Domestic and international markets – selling bioethanol
domestically in Brazil and also to international markets such as the
US and Europe through our integrated supply and trading function.
We are also investing in the development and commercialization of
biobutanol, in conjunction with our partner DuPont. Compared with
other biofuels, biobutanol has the potential to be blended with fuels in
higher proportions, and be easier to transport, store and manage. We
are also investigating a number of chemical applications for this
advanced biofuel.
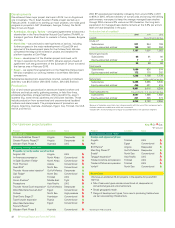
Our performance summary
• We have reduced our recordable injury frequency by more than 60%
since the acquisition of Companhia Nacional de Açúcar e Álcool in
2011. For more information, see Safety on page 45.
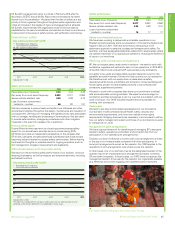
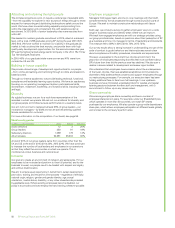
• We increased our production of ethanol equivalent by 47% compared
with 2014 and generated 677GWh of power for Brazil’s national grid.
• We divested our interest in Vivergo Fuels – a UK-based joint
venture★ producing bioethanol from wheat – in May 2015.
• We are improving our agricultural operational performance with a
36% increase in cane harvester efficiency relative to 2014, and in
2015, we farmed a total planted area of 127,000 hectares.
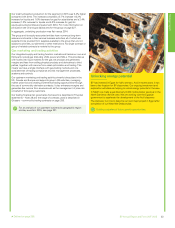
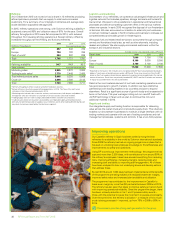
Wind
We are among the top wind energy producers in the US. Our focus is
on safe operations and optimizing performance.
BP holds interests in 16 onshore wind farms in the US, and BP is the
operator of 14 of these. Our net generating capacity★ from this
portfolio, based on our financial stake, was 1,556 megawatts (MW) of
electricity at 31 December 2015.
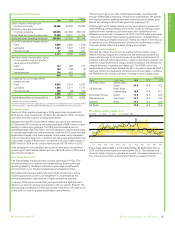
BP Brazil biofuels production
(million litres of ethanol equivalent)
2011 2012 2013 2014 2015
200
400
600
800
1,000
313
403
492
795
542
BP Annual Report and Form 20-F 201540