BP 2015 Annual Report Download - page 49
Download and view the complete annual report
Please find page 49 of the 2015 BP annual report below. You can navigate through the pages in the report by either clicking on the pages listed below, or by using the keyword search tool below to find specific information within the annual report.-
 1
1 -
2
-
3
-
4
-
5
-
6
-
7
-
8
-
9
-
10
-
11
-
12
-
13
-
14
-
15
-
16
-
17
-
18
-
19
-
20
-
21
-
22
-
23
-
24
-
25
-
26
-
27
-
28
-
29
-
30
-
31
-
32
-
33
-
34
-
35
-
36
-
37
-
38
-
 39
39 -
 40
40 -
 41
41 -
 42
42 -
 43
43 -
 44
44 -
 45
45 -
 46
46 -
 47
47 -
 48
48 -
 49
49 -
 50
50 -
 51
51 -
 52
52 -
 53
53 -
 54
54 -
 55
55 -
 56
56 -
 57
57 -
 58
58 -
 59
59 -
60
-
61
-
62
-
63
-
64
-
65
-
66
-
67
-
68
-
69
-
70
-
71
-
72
-
73
-
74
-
75
-
76
-
77
-
78
-
79
-
80
-
81
-
82
-
83
-
84
-
85
-
86
-
87
-
88
-
89
-
90
-
91
-
92
-
93
-
94
-
95
-
96
-
97
-
98
-
99
-
100
-
101
-
102
-
103
-
104
-
105
-
106
-
107
-
108
-
109
-
110
-
111
-
112
-
113
-
114
-
115
-
116
-
117
-
118
-
119
-
120
-
121
-
122
-
123
-
124
-
125
-
126
-
127
-
128
-
129
-
130
-
131
-
132
-
133
-
134
-
135
-
136
-
137
-
138
-
139
-
140
-
141
-
142
-
143
-
144
-
145
-
146
-
147
-
148
-
149
-
150
-
151
-
152
-
153
-
154
-
155
-
156
-
157
-
158
-
159
-
160
-
161
-
162
-
163
-
164
-
165
-
166
-
167
-
168
-
169
-
170
-
171
-
172
-
173
-
174
-
175
-
176
-
177
-
178
-
179
-
180
-
181
-
182
-
183
-
184
-
185
-
186
-
187
-
188
-
189
-
190
-
191
-
192
-
193
-
194
-
195
-
196
-
197
-
198
-
199
-
200
-
201
-
202
-
203
-
204
-
205
-
206
-
207
-
208
-
209
-
210
-
211
-
212
-
213
-
214
-
215
-
216
-
217
-
218
-
219
-
220
-
221
-
222
-
223
-
224
-
225
-
226
-
227
-
228
-
229
-
230
-
231
-
232
-
233
-
234
-
235
-
236
-
237
-
238
-
239
-
240
-
241
-
242
-
243
-
244
-
245
-
246
-
247
-
248
-
249
-
250
-
251
-
252
-
253
-
254
-
255
-
256
-
257
-
258
-
259
-
260
-
261
-
262
-
263
-
264
-
265
-
266
 |
 |

Mr Sandlin’s engagement came to a close in February 2016 after he
reported to SEEAC that all 26 Bly Report recommendations had been
closed out to his satisfaction. He stated that the idea of safety as a top
priority is firmly ingrained throughout the global wells organization and
noted an increase in the degree of rigour and engagement at all levels.
Mr Sandlin recommended the organization build on the foundations
established by the recommendations and maintain its focus on continuous
improvement in the areas of safety culture, self-verification and training.
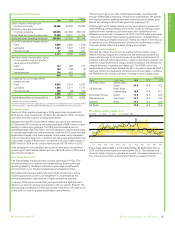
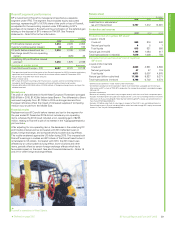
Downstream safety
Safety performance
2015 2014 2013
Recordable injury frequency 0.260.34 0.25
Day away from work case frequency 0.092 0.121 0.063
Severe vehicle accident rate 0.09 0.09 0.10
Loss of primary containment
incidents – number 66 82 101
We take measures to prevent leaks and spills at our refineries and other
downstream facilities throughout the design, maintenance and operation of
our equipment. We focus on managing the highest priority risks associated
with our storage, handling and processing of hydrocarbons. We also seek
to provide safe locations, emergency procedures and other mitigation
measures in the event of a release, fire or explosion.
Process safety expert
Duane Wilson’s three-year term as a board appointed process safety
expert for our downstream activities came to a close during 2015.
Mr Wilson provided an independent perspective on the progress that
BP’s fuels, lubricants and petrochemicals businesses have made toward
becoming industry leaders in process safety performance. Before leaving,
he shared his thoughts on possible areas for ongoing emphasis, such as
risk management, progress measurement and leadership.
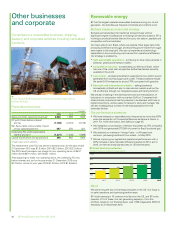
Other businesses and corporate safety
We report on the combined safety performance of our biofuels, wind and
shipping businesses, as well as treasury and corporate activities, including
centralized functions.
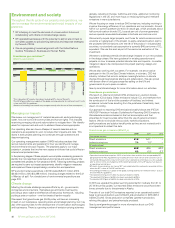
20122011 2013 2014
2015
Key safety metrics 2011-2015
80
60
40
20
100
120
Loss of primary containment
Tier 1 process safety events
Recordable injury frequency
Indexed (2011=100)
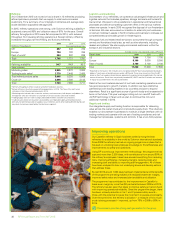
Safety performance
2015 2014 2013
Recordable injury frequency 0.29 0.44 0.47
Day away from work case frequency 0.077 0.067 0.092
Severe vehicle accident rate 0.35 0.480.41
Loss of primary containment
incidents – number 16 17 17
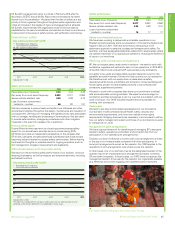
Safety in our biofuels business
We have been working to deliver safe and reliable operations in our
Brazilian biofuels business since our acquisition of Companhia Nacional de
Açúcar e Álcool in 2011. We have done this by introducing a more
systematic approach to personal, process and transportation safety. For
example, we have segregated pedestrian access from several areas where
we operate machinery in our agricultural operations, reducing the likelihood
of injury to our workforce.
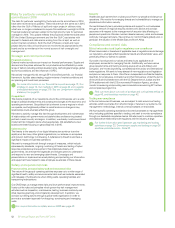
Working with contractors and partners
BP, like our industry peers, rarely works in isolation – we need to work with
contractors, suppliers and partners to carry out our operations. In 2015 52%
of the 353 million hours worked by BP were carried out by contractors.
Our ability to be a safe and responsible operator depends in part on the
capability and performance of those who help us carry out our operations.
We therefore work with our supply chain on areas such as safety,
operational performance, anti-bribery and corruption, money laundering and
human rights, and aim to have suitable provisions in our contracts with
contractors, suppliers and partners.
We seek to work with companies that share our commitment to ethical,
safe and sustainable working practices. We expect and encourage our
contractors and their employees to act in a way that is consistent with our
code of conduct. Our OMS includes requirements and practices for
working with contractors.
Contractors
We seek to set clear and consistent expectations of our contractors.
Our standard model contracts include health, safety, security and
environmental requirements, and most now include human rights
requirements. Bridging documents are necessary in some cases to define
how our safety management system and those of our contractors co-exist
to manage risk on a site.
Our partners in joint arrangements
We have a group framework for identifying and managing BP’s exposure
related to safety, operational, and bribery and corruption risk from our
participation in non-operated joint arrangements .
Typically, our level of influence or control over a joint arrangement is linked
to the size of our financial stake compared with other participants. In
some joint arrangements we act as the operator. Our OMS applies to the
operations of joint arrangements only where we are the operator.
In other cases, one of our partners may be the designated operator or the
operator may be an incorporated joint arrangement company owned by
BP and other companies. In those cases, our OMS does not apply as the
management system to be used by the operator, but is generally available
as a reference point when engaging with operators and co-venturers.
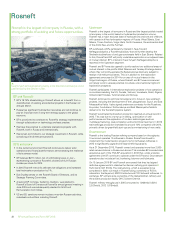
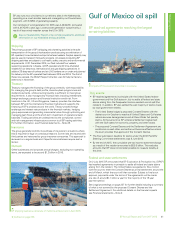
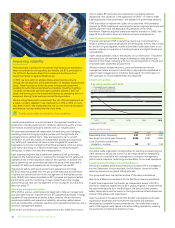
The Ocean Victory drilling rig in the Juniper field, Trinidad.
Defined on page 256.
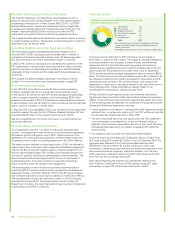
20122011 2013 2014
2015
Key safety metrics 2011-2015a
120
90
60
30
150
180
Loss of primary containment
Recordable injury frequency
Indexed (2011=100)
a
This does not include API tier 1 process safety events for our other businesses and
corporate as the current definition is not applicable in many cases.
BP Annual Report and Form 20-F 2015 45
Strategic report