BP 2015 Annual Report Download - page 47
Download and view the complete annual report
Please find page 47 of the 2015 BP annual report below. You can navigate through the pages in the report by either clicking on the pages listed below, or by using the keyword search tool below to find specific information within the annual report.-
 1
1 -
2
-
3
-
4
-
5
-
6
-
7
-
8
-
9
-
10
-
11
-
12
-
13
-
14
-
15
-
16
-
17
-
18
-
19
-
20
-
21
-
22
-
23
-
24
-
25
-
26
-
27
-
28
-
29
-
30
-
31
-
32
-
33
-
34
-
35
-
36
-
 37
37 -
 38
38 -
 39
39 -
 40
40 -
 41
41 -
 42
42 -
 43
43 -
 44
44 -
 45
45 -
 46
46 -
 47
47 -
 48
48 -
 49
49 -
 50
50 -
 51
51 -
 52
52 -
 53
53 -
 54
54 -
 55
55 -
 56
56 -
 57
57 -
58
-
59
-
60
-
61
-
62
-
63
-
64
-
65
-
66
-
67
-
68
-
69
-
70
-
71
-
72
-
73
-
74
-
75
-
76
-
77
-
78
-
79
-
80
-
81
-
82
-
83
-
84
-
85
-
86
-
87
-
88
-
89
-
90
-
91
-
92
-
93
-
94
-
95
-
96
-
97
-
98
-
99
-
100
-
101
-
102
-
103
-
104
-
105
-
106
-
107
-
108
-
109
-
110
-
111
-
112
-
113
-
114
-
115
-
116
-
117
-
118
-
119
-
120
-
121
-
122
-
123
-
124
-
125
-
126
-
127
-
128
-
129
-
130
-
131
-
132
-
133
-
134
-
135
-
136
-
137
-
138
-
139
-
140
-
141
-
142
-
143
-
144
-
145
-
146
-
147
-
148
-
149
-
150
-
151
-
152
-
153
-
154
-
155
-
156
-
157
-
158
-
159
-
160
-
161
-
162
-
163
-
164
-
165
-
166
-
167
-
168
-
169
-
170
-
171
-
172
-
173
-
174
-
175
-
176
-
177
-
178
-
179
-
180
-
181
-
182
-
183
-
184
-
185
-
186
-
187
-
188
-
189
-
190
-
191
-
192
-
193
-
194
-
195
-
196
-
197
-
198
-
199
-
200
-
201
-
202
-
203
-
204
-
205
-
206
-
207
-
208
-
209
-
210
-
211
-
212
-
213
-
214
-
215
-
216
-
217
-
218
-
219
-
220
-
221
-
222
-
223
-
224
-
225
-
226
-
227
-
228
-
229
-
230
-
231
-
232
-
233
-
234
-
235
-
236
-
237
-
238
-
239
-
240
-
241
-
242
-
243
-
244
-
245
-
246
-
247
-
248
-
249
-
250
-
251
-
252
-
253
-
254
-
255
-
256
-
257
-
258
-
259
-
260
-
261
-
262
-
263
-
264
-
265
-
266
 |
 |

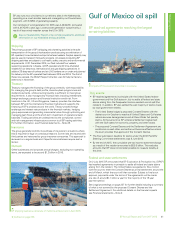
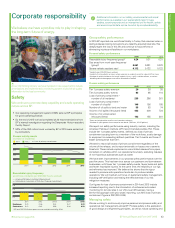
Corporate responsibility
• Our operating management system (OMS) sets out BP’s principles
for good operating practice.
• By the end of 2015 we had completed all 26 recommendations from
BP’s internal investigation regarding the Deepwater Horizon accident,
the Bly Report.
• 52% of the 353 million hours worked by BP in 2015 were carried out
by contractors.
Group safety performance
In 2015 BP reported one workforce fatality in Turkey that occurred when a
ceiling collapsed during renovations at a recently acquired retail site. We
deeply regret the loss of this life and continue to focus efforts on
eliminating injuries and fatalities in our workplaces.
Personal safety performance
2015 2014 2013
Recordable injury frequency (group)b0.24 0.31 0.31
Day away from work case frequencyc
(group)b 0.061 0.081 0.070
Severe vehicle accident rated0.112 0.132 0.122
b Incidents per 200,000 hours worked.
c Incidents that resulted in an injury where a person is unable to work for a day (shift) or more.
d Number of vehicle incidents that result in death, injury, a spill, a vehicle rollover, or serious
disabling vehicle damage per one million kilometres travelled.
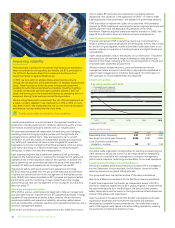
Process safety performance
2015 2014 2013
Tier 1 process safety events★20 28 20
Tier 2 process safety events 83 95 110
Loss of primary containment –
number of all incidentse235 286 261
Loss of primary containment –
number of oil spillsf146 156 185
Number of oil spills to land and water 55 63 74
Volume of oil spilled (thousand litres) 432 400 724
Volume of oil unrecovered
(thousand litres) 142 155 261
e Does not include either small or non-hazardous releases.
f Number of spills greater than or equal to one barrel (159 litres, 42 US gallons).
We report our safety performance using industry metrics, including the
American Petroleum Institute (API) recommended practice 754. These
include tier 1 process safety events, defined as a loss of primary
containment causing harm to a member of the workforce, costly damage
to equipment or exceeding defined quantities. Tier 2 events are those of
lesser consequence than tier 1.
We seek to record all losses of primary containment regardless of the
volume of the release, and to report externally on losses over a severity
threshold. These include unplanned or uncontrolled releases from pipes,
containers or vehicles within our operational boundary, excluding releases
of non-hazardous substances such as water.
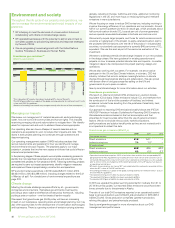
We have seen improvements in our process safety performance over the
past five years. This has been true across our upstream and downstream
businesses, with fewer tier 1 process safety events, fewer leaks and spills
and fewer recordable injuries. At the same time, the reliability of our rigs
and refineries has improved. We believe this shows that the rigour
needed to produce safe operations tends also to produce reliable
operations. We will maintain our focus on systematic safety management,
including self-verification and testing the effectiveness of our risk
mitigation measures.
Our figures for loss of primary containment in 2014 and 2015 include
increased reporting due to the introduction of enhanced automated
monitoring for remote sites in our US Lower 48 business. Using a
like-for-like approach with prior years’ reporting, our 2015 loss of primary
containment figure is 208 (2014 246).
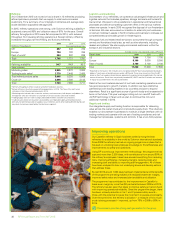
Managing safety
We are working to continuously improve personal and process safety and
operational risk management across BP. Process safety is the application
of good design and engineering principles, as well as robust operating and
We believe we have a positive role to play in shaping
the long-term future of energy.
Safety
We continue to promote deep capability and a safe operating
culture across BP.
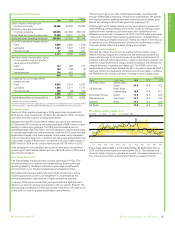
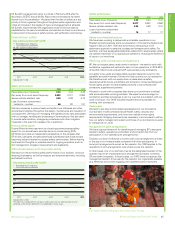
Recordable injury frequency
(workforce incidents per 200,000 hours worked)
International Association of Oil & Gas Producers benchmarka
American Petroleum Institute US benchmarka
a API and OGP 2015 data reports are not available until May 2016.
Employees 0.31 0.26 0.25 0.27
0.20
Contractors 0.41 0.43 0.36 0.34
0.28
0.2
0.6
0.4
0.8
2011 2012 2013 2014
2015
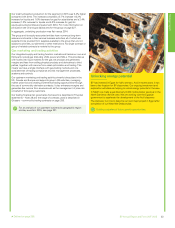
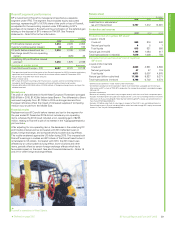
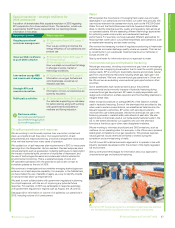
At our US Whiting refinery we have invested in new equipment to reduce
air emissions and implemented a monitoring system to provide air quality
information to the local community.
Process safety events
(number of incidents)
Loss of primary containment
Tier 2Tier 1
100
200
400
300
2011 2012 2013 2014
2015
Additional information on our safety, environmental and social
performance is available in our sustainability report. Case
studies, country reports and an interactive tool for health, safety
and environmental data can be found at bp.com/sustainability
Defined on page 256.BP Annual Report and Form 20-F 2015 43
Strategic report