BP 2015 Annual Report Download - page 83
Download and view the complete annual report
Please find page 83 of the 2015 BP annual report below. You can navigate through the pages in the report by either clicking on the pages listed below, or by using the keyword search tool below to find specific information within the annual report.-
 1
1 -
2
-
3
-
4
-
5
-
6
-
7
-
8
-
9
-
10
-
11
-
12
-
13
-
14
-
15
-
16
-
17
-
18
-
19
-
20
-
21
-
22
-
23
-
24
-
25
-
26
-
27
-
28
-
29
-
30
-
31
-
32
-
33
-
34
-
35
-
36
-
37
-
38
-
39
-
40
-
41
-
42
-
43
-
44
-
45
-
46
-
47
-
48
-
49
-
50
-
51
-
52
-
53
-
54
-
55
-
56
-
57
-
58
-
59
-
60
-
61
-
62
-
63
-
64
-
65
-
66
-
67
-
68
-
69
-
70
-
71
-
72
-
 73
73 -
 74
74 -
 75
75 -
 76
76 -
 77
77 -
 78
78 -
 79
79 -
 80
80 -
 81
81 -
 82
82 -
 83
83 -
 84
84 -
 85
85 -
 86
86 -
 87
87 -
 88
88 -
 89
89 -
 90
90 -
 91
91 -
 92
92 -
 93
93 -
94
-
95
-
96
-
97
-
98
-
99
-
100
-
101
-
102
-
103
-
104
-
105
-
106
-
107
-
108
-
109
-
110
-
111
-
112
-
113
-
114
-
115
-
116
-
117
-
118
-
119
-
120
-
121
-
122
-
123
-
124
-
125
-
126
-
127
-
128
-
129
-
130
-
131
-
132
-
133
-
134
-
135
-
136
-
137
-
138
-
139
-
140
-
141
-
142
-
143
-
144
-
145
-
146
-
147
-
148
-
149
-
150
-
151
-
152
-
153
-
154
-
155
-
156
-
157
-
158
-
159
-
160
-
161
-
162
-
163
-
164
-
165
-
166
-
167
-
168
-
169
-
170
-
171
-
172
-
173
-
174
-
175
-
176
-
177
-
178
-
179
-
180
-
181
-
182
-
183
-
184
-
185
-
186
-
187
-
188
-
189
-
190
-
191
-
192
-
193
-
194
-
195
-
196
-
197
-
198
-
199
-
200
-
201
-
202
-
203
-
204
-
205
-
206
-
207
-
208
-
209
-
210
-
211
-
212
-
213
-
214
-
215
-
216
-
217
-
218
-
219
-
220
-
221
-
222
-
223
-
224
-
225
-
226
-
227
-
228
-
229
-
230
-
231
-
232
-
233
-
234
-
235
-
236
-
237
-
238
-
239
-
240
-
241
-
242
-
243
-
244
-
245
-
246
-
247
-
248
-
249
-
250
-
251
-
252
-
253
-
254
-
255
-
256
-
257
-
258
-
259
-
260
-
261
-
262
-
263
-
264
-
265
-
266
 |
 |

Corporate governance
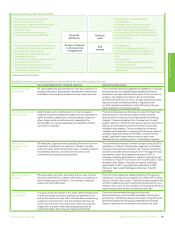
Value measures made up 70% of total bonus. In order to simplify and
reflect both the current short-term imperatives and the 2015 priorities in
the group’s annual plan, the number of value measures was reduced from
six in 2014 to five in 2015. These measures were more heavily weighted
on operating cash flow and underlying replacement cost profit. The
economic environment was taken into account by looking at capital and
cost discipline and these were reflected through two measures – net
investment (organic) and corporate and functional cost management. As in
previous years, delivery of major projects remained a key focus area.
Bob Dudley and Dr Brian Gilvary’s annual bonus was based 100% on these
group-wide measures. Under the policy, one third of the total bonus is paid
in cash. A director is required to defer a further third in BP shares and the
final third is paid either in cash or voluntarily deferred in BP shares at the
individual’s election. Deferred shares are matched on a one-for-one basis,
and both deferred and matched shares vest after three years depending on
an assessment by the committee of safety and environmental
sustainability over the three-year period.
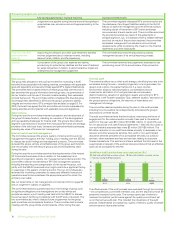
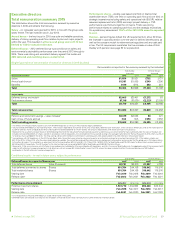
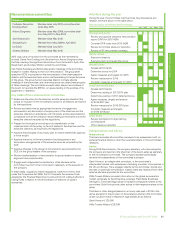
2015 outcomes
In January 2016, the committee considered the group’s performance
during 2015 against the measures and targets set out in the 2015 annual
cash bonus table.
As the table reflects, BP had an excellent year for safety and operational
performance in a difficult environment.
The company’s decision in late 2014 to plan for a ‘lower for longer’ oil price
meant that the leadership acted early and decisively to respond to the low
oil price environment. Strong and continually improving safety standards
have led to higher reliability and improved operations, contributing directly
to better financial outcomes. Cost reduction and net investment have been
managed so as not to compromise future growth. Major projects have
been delivered on time, improving forthcoming performance.
Safety performance was again very encouraging, resulting in maximum
scores for all three measures – tier 1 process safety events, loss of primary
containment and recordable injury frequency.
Operating cash flow for the company was $19.1 billion, well ahead of the
board’s approved plan of the target of $17.2 billion. This target was
normalized upwards since the actual oil price during the year was higher
than original plan assumptions. Underlying replacement cost profit of $5.9
billion was also significantly ahead of the target of $4.2 billion, again
normalized similar to the above. Through greater simplification and
efficiency across all functions, corporate and functional costs were
reduced by 17.6% against a targeted reduction of 5.9%. Capital discipline
was demonstrated through a reduction in the net investment (organic) of
27% against a planned reduction of 18%. Four major projects were
successfully delivered in 2015, as planned.
Based on these results, the overall group performance score was 1.91. The
committee, as is its normal practice, considered this result in the context of
the performance of the group, shareholder feedback, input from the board
and other committees, as well as the circumstances in the wider
environment. Overall, management delivered very well in terms of what
they could control. The committee agreed with the group chief executive’s
view that the dramatic dynamics in the market during the year also needed
to be recognized. He proposed a lower score and the committee agreed
that this reflected a balanced assessment of the year. A final group score
of 1.70 was agreed and applied to BP’s wider management group. In the
case of executive directors, our approved policy limits bonus to a group
score of 1.50.
The overall annual bonus for executive directors was determined by
multiplying the reduced score of 1.5 by the on-target bonus level of 150%
of salary. Both Bob Dudley and Dr Brian Gilvary deferred two thirds of their
2015 annual bonus. As a result Bob Dudley’s and Dr Brian Gilvary’s
bonuses, including the portion deferred, are shown below.
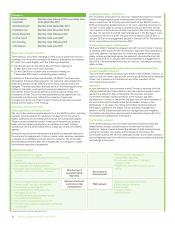
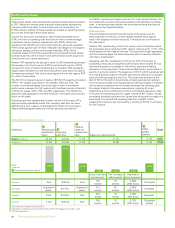
Annual bonus summary
Overall bonus Paid in cash Deferred in BP shares
Bob Dudley $ 4,171,500 $1,390,500 $2,781,000
Dr Brian Gilvary £1,645,875 £548,625 £1,097,250
2016 implementation
For 2016, 100% of Bob Dudley’s and Dr Brian Gilvary’s bonus will be
based on group results.
For the 2016 annual bonus the committee will continue to focus on the
two overall themes of safety and value. Safety will continue to have a 30%
weight in the overall bonus plan. The value measures are key to short-term
performance within the group and will have an overall weight of 70%.
Continued improvement in safety remains a group priority and is fully
reflected in the measures. As in 2015, the safety targets are anchored
on a realistic and achievable improvement from the average of the previous
three years.
The value measures have been decreased from 5 in 2015 to 4 in 2016,
increasing the weight on operating cash flow and underlying replacement
cost profit and removing the net investment measure. Targets for each
measure are challenging but realistic and have been set in the context of
the current environment. As usual they will be normalized at year end to
reflect changes in oil and gas price and refining margins.
Safety and value targets will be disclosed retrospectively in the 2016
remuneration report to the extent that they are no longer considered
commercially sensitive. The full set of 2016 short-term measures are set
out in the diagram on page 76.
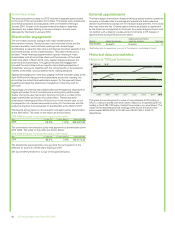
Deferred bonus
2015 outcomes
Both Bob Dudley and Dr Brian Gilvary deferred two thirds of their 2012
annual bonus in accordance with the terms of the policy then in place.
The three-year performance period concluded at the end of 2015. The
committee reviewed safety and environmental sustainability performance
over this period and sought the input of the safety, ethics and environment
assurance committee (SEEAC). Over the three-year period 2013-15 safety
performance showed steady improvement on a range of measures. All
performance hurdles were met and the group-wide operating
management system★ is now sufficiently embedded throughout the
organization to continue driving improvement in environmental as well as
safety areas.
Following the committee’s review, full vesting of the deferred and matched
shares for the 2012 deferred bonus was approved, as shown in the
following table (as well as in the single figure table on page 77).
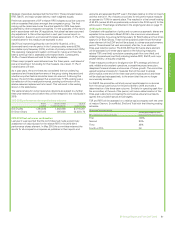
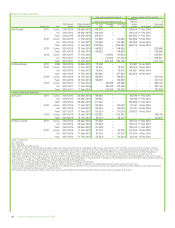
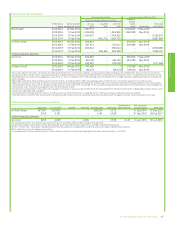
2012 deferred bonus vesting
Name
Shares
deferred
Vesting
agreed
Total shares
including
dividends
Total
value
at vesting
Bob Dudley 458,760 100% 539,424 $2,602,721
Dr Brian Gilvary 315,260 100% 380,905 £1,272,223
Details of the deferred bonus awards made to the executive directors in
early 2015, in relation to 2014 annual bonuses, were set out in last year’s
report. A summary of these awards is included on page 86.
2016 implementation
The committee has determined that the safety and environmental
sustainability hurdle will continue to apply to shares deferred from the
2015 bonus. All matched shares that vest in 2019 will, after sufficient
shares have been sold to pay tax, be subject to an additional three-year
retention period before being released to the individual in 2022. This further
reinforces long-term shareholder alignment and the nature of the
group’s business.
Defined on page 256.BP Annual Report and Form 20-F 2015 79