BP 2015 Annual Report Download - page 28
Download and view the complete annual report
Please find page 28 of the 2015 BP annual report below. You can navigate through the pages in the report by either clicking on the pages listed below, or by using the keyword search tool below to find specific information within the annual report.-
 1
1 -
2
-
3
-
4
-
5
-
6
-
7
-
8
-
9
-
10
-
11
-
12
-
13
-
14
-
15
-
16
-
17
-
 18
18 -
 19
19 -
 20
20 -
 21
21 -
 22
22 -
 23
23 -
 24
24 -
 25
25 -
 26
26 -
 27
27 -
 28
28 -
 29
29 -
 30
30 -
 31
31 -
 32
32 -
 33
33 -
 34
34 -
 35
35 -
 36
36 -
 37
37 -
 38
38 -
39
-
40
-
41
-
42
-
43
-
44
-
45
-
46
-
47
-
48
-
49
-
50
-
51
-
52
-
53
-
54
-
55
-
56
-
57
-
58
-
59
-
60
-
61
-
62
-
63
-
64
-
65
-
66
-
67
-
68
-
69
-
70
-
71
-
72
-
73
-
74
-
75
-
76
-
77
-
78
-
79
-
80
-
81
-
82
-
83
-
84
-
85
-
86
-
87
-
88
-
89
-
90
-
91
-
92
-
93
-
94
-
95
-
96
-
97
-
98
-
99
-
100
-
101
-
102
-
103
-
104
-
105
-
106
-
107
-
108
-
109
-
110
-
111
-
112
-
113
-
114
-
115
-
116
-
117
-
118
-
119
-
120
-
121
-
122
-
123
-
124
-
125
-
126
-
127
-
128
-
129
-
130
-
131
-
132
-
133
-
134
-
135
-
136
-
137
-
138
-
139
-
140
-
141
-
142
-
143
-
144
-
145
-
146
-
147
-
148
-
149
-
150
-
151
-
152
-
153
-
154
-
155
-
156
-
157
-
158
-
159
-
160
-
161
-
162
-
163
-
164
-
165
-
166
-
167
-
168
-
169
-
170
-
171
-
172
-
173
-
174
-
175
-
176
-
177
-
178
-
179
-
180
-
181
-
182
-
183
-
184
-
185
-
186
-
187
-
188
-
189
-
190
-
191
-
192
-
193
-
194
-
195
-
196
-
197
-
198
-
199
-
200
-
201
-
202
-
203
-
204
-
205
-
206
-
207
-
208
-
209
-
210
-
211
-
212
-
213
-
214
-
215
-
216
-
217
-
218
-
219
-
220
-
221
-
222
-
223
-
224
-
225
-
226
-
227
-
228
-
229
-
230
-
231
-
232
-
233
-
234
-
235
-
236
-
237
-
238
-
239
-
240
-
241
-
242
-
243
-
244
-
245
-
246
-
247
-
248
-
249
-
250
-
251
-
252
-
253
-
254
-
255
-
256
-
257
-
258
-
259
-
260
-
261
-
262
-
263
-
264
-
265
-
266
 |
 |

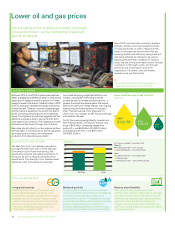
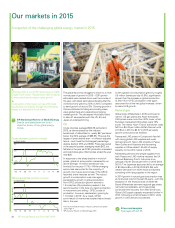
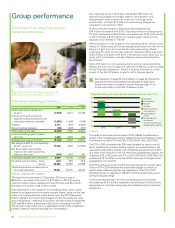
Our markets in 2015
A snapshot of the challenging global energy market in 2015.
The global economy struggled to return to a more
normal pace of growth in 2015 – GDP growth
estimates were revised down over the course of
the year, with latest estimates indicating that the
world economy grew by 2.5% in 2015, compared
to trend growth of around 3%. Slowing growth in
China contributed to falling commodity prices,
weak global trade and weakening emerging
market growth. The developed world also failed
to take off as expected with the US, EU and
Japan all underperforming.
Oil
Crude oil prices averaged $52.39 per barrel in
2015, as demonstrated by the industry
benchmark of dated Brent , nearly $47 per barrel
below the 2014 average of $98.95. This was the
largest oil price decline ever – in inflation-adjusted
terms – and it was the third-largest percentage
decline (behind 1873 and 1986). Prices recovered
in the second quarter, averaging nearly $62, but
fell later in the year as OPEC production increased
and inventories grew. Brent prices ended the year
near $35.
In response to the sharp decline in world oil
prices, global oil consumption increased by an
above-average 1.6 million barrels per day
(mmb/d) for the year (1.7%).a While emerging
economies accounted for the majority of
growth, the mature economies of the OECD
recorded a rare increase as well. The robust
growth in consumption was once again
exceeded by growth in global production.
Non-OPEC production growth slowed to
1.4mmb/d as US production peaked in the
second quarter in the face of a rapid contraction
in investment and drilling.a OPEC crude oil
production, however, accelerated, growing by
1.1mmb/d in 2015.a As a result, OECD
commercial oil inventories reached record levels
late in the year.
In 2014 global oil consumption grew by roughly
0.8 million barrels per day (0.8%), significantly
slower than the increase in global production
(2.3%).b Non-OPEC production once again
accounted for all the net global increase, driven
by record US growth.
Natural gas
Global price differentials in 2015 continued to
narrow. US gas prices and Asian transacted
LNG prices were more than 40% lower, while
European transacted LNG prices were 15%
lower. The Henry Hub First of the Month index
fell from $4.43 per million British thermal units
(mmBtu) in 2014 to $2.67 in 2015 as supply
growth continued to be resilient.
Transacted LNG prices in Europe and Asia fell
with rising global LNG supplies and weak
demand growth. New LNG projects in Papua
New Guinea and Australia and recovering
supplies in Africa added 1.4bcf/d of supply
capacity to the LNG market in 2015.
Moderating demand and ample supplies from
both Russia and LNG markets reduced the UK
National Balancing Point hub price to an
average of 42.61 pence per therm in 2015 (2014
50.01). The Japanese spot price fell to an average
of $7.45/mmBtu in 2015 (2014 $13.86) with
weaker demand from North Asian consumers
coinciding with rising supplies in the region.
In 2014 growth in natural gas consumption was
at its slowest rate for the last 20 years – with the
exception of the financial crisis of 2008-09.
Broad differentials between regional gas prices
narrowed considerably, as US gas prices
continued their recovery from their 2012 lows.
Global LNG supply capacity expanded further in
2014, following a small increase in 2013, while
growth in LNG demand moderated.
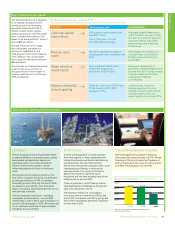
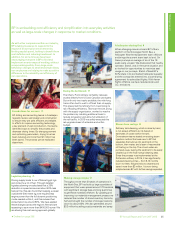
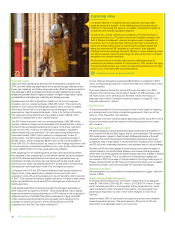
More than 200 of our UK BP stores have an M&S
Simply Food® outlet. This premium offer is helping
to drive overall service station sales growth.
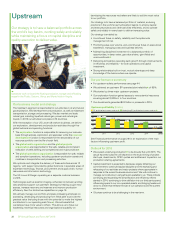
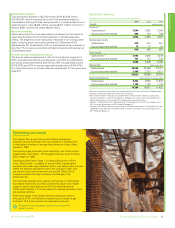
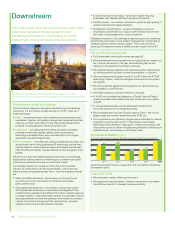
Construction of Glen Lyon, our new 270 metre
long floating, production, storage and offloading
vessel, at a shipyard in South Korea.
a From IEA Oil Market Report, February 2016 ©, OECD/IEA
2016, Page 4.
b BP Statistical Review of World Energy 2015. Prices and margins
See pages 29 and 35.
BP Statistical Review of World Energy
See bp.com/statisticalreview for an
objective review of key global energy
trends.
US dollars per barrel
06 07 08 09 10 11 12 13 14 15
Crude oil prices (quarterly average)
150
120
90
60
Brent dated
US dollars gas prices
06 07 08 09 10 11 12 13 14 15
Natural gas prices (quarterly average)
12
10
8
6
4
Henry Hub
BP Annual Report and Form 20-F 201524