BP 2015 Annual Report Download - page 7
Download and view the complete annual report
Please find page 7 of the 2015 BP annual report below. You can navigate through the pages in the report by either clicking on the pages listed below, or by using the keyword search tool below to find specific information within the annual report.-
 1
1 -
 2
2 -
 3
3 -
 4
4 -
 5
5 -
 6
6 -
 7
7 -
 8
8 -
 9
9 -
 10
10 -
 11
11 -
 12
12 -
 13
13 -
 14
14 -
 15
15 -
 16
16 -
 17
17 -
 18
18 -
19
-
20
-
21
-
22
-
23
-
24
-
25
-
26
-
27
-
28
-
29
-
30
-
31
-
32
-
33
-
34
-
35
-
36
-
37
-
38
-
39
-
40
-
41
-
42
-
43
-
44
-
45
-
46
-
47
-
48
-
49
-
50
-
51
-
52
-
53
-
54
-
55
-
56
-
57
-
58
-
59
-
60
-
61
-
62
-
63
-
64
-
65
-
66
-
67
-
68
-
69
-
70
-
71
-
72
-
73
-
74
-
75
-
76
-
77
-
78
-
79
-
80
-
81
-
82
-
83
-
84
-
85
-
86
-
87
-
88
-
89
-
90
-
91
-
92
-
93
-
94
-
95
-
96
-
97
-
98
-
99
-
100
-
101
-
102
-
103
-
104
-
105
-
106
-
107
-
108
-
109
-
110
-
111
-
112
-
113
-
114
-
115
-
116
-
117
-
118
-
119
-
120
-
121
-
122
-
123
-
124
-
125
-
126
-
127
-
128
-
129
-
130
-
131
-
132
-
133
-
134
-
135
-
136
-
137
-
138
-
139
-
140
-
141
-
142
-
143
-
144
-
145
-
146
-
147
-
148
-
149
-
150
-
151
-
152
-
153
-
154
-
155
-
156
-
157
-
158
-
159
-
160
-
161
-
162
-
163
-
164
-
165
-
166
-
167
-
168
-
169
-
170
-
171
-
172
-
173
-
174
-
175
-
176
-
177
-
178
-
179
-
180
-
181
-
182
-
183
-
184
-
185
-
186
-
187
-
188
-
189
-
190
-
191
-
192
-
193
-
194
-
195
-
196
-
197
-
198
-
199
-
200
-
201
-
202
-
203
-
204
-
205
-
206
-
207
-
208
-
209
-
210
-
211
-
212
-
213
-
214
-
215
-
216
-
217
-
218
-
219
-
220
-
221
-
222
-
223
-
224
-
225
-
226
-
227
-
228
-
229
-
230
-
231
-
232
-
233
-
234
-
235
-
236
-
237
-
238
-
239
-
240
-
241
-
242
-
243
-
244
-
245
-
246
-
247
-
248
-
249
-
250
-
251
-
252
-
253
-
254
-
255
-
256
-
257
-
258
-
259
-
260
-
261
-
262
-
263
-
264
-
265
-
266
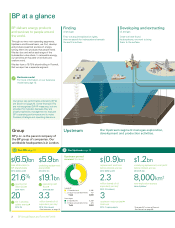
 |
 |

We move hydrocarbons using pipelines,
ships, trucks and trains and use our trading
capability to capture value across the
supply chain.
We refine, process and blend
hydrocarbons to make fuels, lubricants
and petrochemicals.
Transporting and trading
oil and gas
Marketing
fuels and products
Manufacturing
fuels and products
We supply our customers with fuel for
transportation, energy for heat and light,
lubricants to keep engines moving and the
petrochemicals required to make a variety
of everyday items.
Generating
renewable energy
We operate a biofuels business in Brazil and an
onshore wind business in the US.
Petrochemicals
International oil and
gas markets
Renewables
Fuels
Lubricants
See Downstream page 34.See Renewable energy page 40.
Downstream Our Downstream segment operates
hydrocarbon value chains covering three
main businesses – fuels, lubricants and
petrochemicals.
Data provided on pages 2-5 is at or for the year
ended 31 December 2015, unless otherwise
indicated.
$7.1bn
replacement cost profit
before interest and tax
2014: $3.7bn
1.7
million barrels of oil refined
per day
2014: 1.7mmb/d
795
million litres of ethanol equivalent
produced at our three mills in Brazil
2014: 542 million litres
42%
of our lubricants sales were
premium grades
2014: 41%
4,424
gigawatt hours of electricity generated
at our 16 US wind farms
2014: 4,617GWh
14.8
million tonnes of petrochemicals
produced in the year
2014: 14.0mmte
$7.5bn
underlying replacement cost
profit before interest and tax
2014: $4.4bn
c See page 218.
★ Defined on page 256.
1
3
2
1. Fuels $29.2bn
2. Lubricants $1.3bn
3. Petrochemicals $4.4bn
Operating capital
employed c
BP Annual Report and Form 20-F 2015 3
Strategic report