BP 2015 Annual Report Download - page 172
Download and view the complete annual report
Please find page 172 of the 2015 BP annual report below. You can navigate through the pages in the report by either clicking on the pages listed below, or by using the keyword search tool below to find specific information within the annual report.-
 1
1 -
2
-
3
-
4
-
5
-
6
-
7
-
8
-
9
-
10
-
11
-
12
-
13
-
14
-
15
-
16
-
17
-
18
-
19
-
20
-
21
-
22
-
23
-
24
-
25
-
26
-
27
-
28
-
29
-
30
-
31
-
32
-
33
-
34
-
35
-
36
-
37
-
38
-
39
-
40
-
41
-
42
-
43
-
44
-
45
-
46
-
47
-
48
-
49
-
50
-
51
-
52
-
53
-
54
-
55
-
56
-
57
-
58
-
59
-
60
-
61
-
62
-
63
-
64
-
65
-
66
-
67
-
68
-
69
-
70
-
71
-
72
-
73
-
74
-
75
-
76
-
77
-
78
-
79
-
80
-
81
-
82
-
83
-
84
-
85
-
86
-
87
-
88
-
89
-
90
-
91
-
92
-
93
-
94
-
95
-
96
-
97
-
98
-
99
-
100
-
101
-
102
-
103
-
104
-
105
-
106
-
107
-
108
-
109
-
110
-
111
-
112
-
113
-
114
-
115
-
116
-
117
-
118
-
119
-
120
-
121
-
122
-
123
-
124
-
125
-
126
-
127
-
128
-
129
-
130
-
131
-
132
-
133
-
134
-
135
-
136
-
137
-
138
-
139
-
140
-
141
-
142
-
143
-
144
-
145
-
146
-
147
-
148
-
149
-
150
-
151
-
152
-
153
-
154
-
155
-
156
-
157
-
158
-
159
-
160
-
161
-
 162
162 -
 163
163 -
 164
164 -
 165
165 -
 166
166 -
 167
167 -
 168
168 -
 169
169 -
 170
170 -
 171
171 -
 172
172 -
 173
173 -
 174
174 -
 175
175 -
 176
176 -
 177
177 -
 178
178 -
 179
179 -
 180
180 -
 181
181 -
 182
182 -
183
-
184
-
185
-
186
-
187
-
188
-
189
-
190
-
191
-
192
-
193
-
194
-
195
-
196
-
197
-
198
-
199
-
200
-
201
-
202
-
203
-
204
-
205
-
206
-
207
-
208
-
209
-
210
-
211
-
212
-
213
-
214
-
215
-
216
-
217
-
218
-
219
-
220
-
221
-
222
-
223
-
224
-
225
-
226
-
227
-
228
-
229
-
230
-
231
-
232
-
233
-
234
-
235
-
236
-
237
-
238
-
239
-
240
-
241
-
242
-
243
-
244
-
245
-
246
-
247
-
248
-
249
-
250
-
251
-
252
-
253
-
254
-
255
-
256
-
257
-
258
-
259
-
260
-
261
-
262
-
263
-
264
-
265
-
266
 |
 |

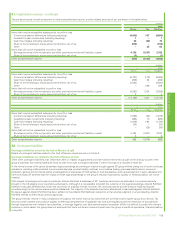
37. Condensed consolidating information on certain US subsidiaries – continued
Cash flow statement
$ million
For the year ended 31 December 2015
Issuer Guarantor
BP
Exploration
(Alaska) Inc. BP p.l.c.
Other
subsidiaries BP group
Net cash provided by operating activities 925 6,628 11,580 19,133
Net cash provided by (used in) investing activities (925) – (16,375) (17,300)
Net cash provided by (used in) financing activities – (6,659) 2,124 (4,535)
Currency translation differences relating to cash and cash equivalents – – (672) (672)
Increase (decrease) in cash and cash equivalents – (31) (3,343) (3,374)
Cash and cash equivalents at beginning of year – 31 29,732 29,763
Cash and cash equivalents at end of year – – 26,389 26,389
$ million
For the year ended 31 December 2014
Issuer Guarantor
BP
Exploration
(Alaska) Inc. BP p.l.c.a
Other
subsidiaries BP group
Net cash provided by operating activities 92 10,464 22,198 32,754
Net cash provided by (used in) investing activities (92) – (19,482) (19,574)
Net cash provided by (used in) financing activities – (10,439) 5,173 (5,266)
Currency translation differences relating to cash and cash equivalents – – (671) (671)
Increase (decrease) in cash and cash equivalents – 25 7,218 7,243
Cash and cash equivalents at beginning of year – 6 22,514 22,520
Cash and cash equivalents at end of year – 31 29,732 29,763
$ million
For the year ended 31 December 2013
Issuer Guarantor
BP
Exploration
(Alaska) Inc. BP p.l.c.a
Other
subsidiaries BP group
Net cash provided by operating activities 746 10,796 9,558 21,100
Net cash provided by (used in) investing activities (746) – (7,109) (7,855)
Net cash provided by (used in) financing activities – (10,799) 399 (10,400)
Currency translation differences relating to cash and cash equivalents – – 40 40
Increase (decrease) in cash and cash equivalents – (3) 2,888 2,885
Cash and cash equivalents at beginning of year – 9 19,626 19,635
Cash and cash equivalents at end of year – 6 22,514 22,520
aFor 2014 and 2013 BP p.l.c. comparative information certain adjustments have been made to the amounts reported for operating, investing and financing activities, with no overall impact on net
cash flow.
168 BP Annual Report and Form 20-F 2015