BP 2015 Annual Report Download - page 23
Download and view the complete annual report
Please find page 23 of the 2015 BP annual report below. You can navigate through the pages in the report by either clicking on the pages listed below, or by using the keyword search tool below to find specific information within the annual report.-
 1
1 -
2
-
3
-
4
-
5
-
6
-
7
-
8
-
9
-
10
-
11
-
12
-
 13
13 -
 14
14 -
 15
15 -
 16
16 -
 17
17 -
 18
18 -
 19
19 -
 20
20 -
 21
21 -
 22
22 -
 23
23 -
 24
24 -
 25
25 -
 26
26 -
 27
27 -
 28
28 -
 29
29 -
 30
30 -
 31
31 -
 32
32 -
 33
33 -
34
-
35
-
36
-
37
-
38
-
39
-
40
-
41
-
42
-
43
-
44
-
45
-
46
-
47
-
48
-
49
-
50
-
51
-
52
-
53
-
54
-
55
-
56
-
57
-
58
-
59
-
60
-
61
-
62
-
63
-
64
-
65
-
66
-
67
-
68
-
69
-
70
-
71
-
72
-
73
-
74
-
75
-
76
-
77
-
78
-
79
-
80
-
81
-
82
-
83
-
84
-
85
-
86
-
87
-
88
-
89
-
90
-
91
-
92
-
93
-
94
-
95
-
96
-
97
-
98
-
99
-
100
-
101
-
102
-
103
-
104
-
105
-
106
-
107
-
108
-
109
-
110
-
111
-
112
-
113
-
114
-
115
-
116
-
117
-
118
-
119
-
120
-
121
-
122
-
123
-
124
-
125
-
126
-
127
-
128
-
129
-
130
-
131
-
132
-
133
-
134
-
135
-
136
-
137
-
138
-
139
-
140
-
141
-
142
-
143
-
144
-
145
-
146
-
147
-
148
-
149
-
150
-
151
-
152
-
153
-
154
-
155
-
156
-
157
-
158
-
159
-
160
-
161
-
162
-
163
-
164
-
165
-
166
-
167
-
168
-
169
-
170
-
171
-
172
-
173
-
174
-
175
-
176
-
177
-
178
-
179
-
180
-
181
-
182
-
183
-
184
-
185
-
186
-
187
-
188
-
189
-
190
-
191
-
192
-
193
-
194
-
195
-
196
-
197
-
198
-
199
-
200
-
201
-
202
-
203
-
204
-
205
-
206
-
207
-
208
-
209
-
210
-
211
-
212
-
213
-
214
-
215
-
216
-
217
-
218
-
219
-
220
-
221
-
222
-
223
-
224
-
225
-
226
-
227
-
228
-
229
-
230
-
231
-
232
-
233
-
234
-
235
-
236
-
237
-
238
-
239
-
240
-
241
-
242
-
243
-
244
-
245
-
246
-
247
-
248
-
249
-
250
-
251
-
252
-
253
-
254
-
255
-
256
-
257
-
258
-
259
-
260
-
261
-
262
-
263
-
264
-
265
-
266
 |
 |

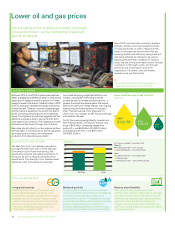
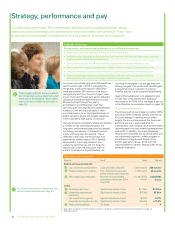
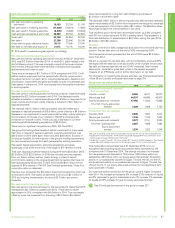
Our financial framework
How we are putting this into action
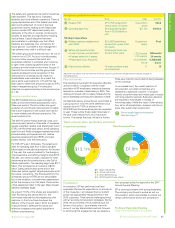
Our financial framework is designed
to re-establish a balance where
operating cash flow (excluding
payments related to the Gulf of
Mexico oil spill) covers organic
capital expenditure★ and the current
level of dividend per share by 2017,
based on an average Brent★ price of
around $60 per barrel.
If prices remain lower for longer
than anticipated, we expect to
continue to recalibrate for the
weaker environment and to capture
more deflation. We would expect
this to drop the balance point below
$60 per barrel.
We will keep our financial framework
under review as we monitor oil
and gas prices and their impact on
industry costs as we move through
2016 and beyond.
★ Defined on page 256.
Looking ahead
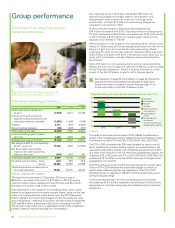
2015 achievement
Principle
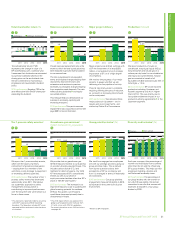
Figures exclude retail staff and agricultural, operational and
seasonal workers in Brazil.
Our financial framework – through 2017
Underpinning our commitment to sustain the dividend for our shareholders
2013 2014 2015
70,000
65,000
60,000
55,000
B
P group employees (at 31 December)
65,500 64,800
59,400
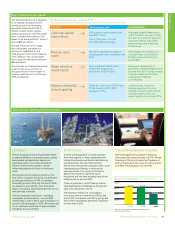
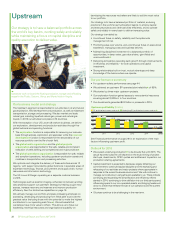
Upstream
We are focusing on the timing of investments
to capture deflation in the supply chain, paring
back access and exploration spend and
prioritizing activity in our base operations.
Where we are not the operator, we are
influencing partners to focus on third-party
costs.
We reduced unit production costs by more
than 20% compared with 2013 and achieved
an average reduction of 15% in upstream
third-party costs in 2015. By the end of 2016,
we expect to re-bid 40% of our third-party
spend, including a significant proportion of our
well services contracts.
Our total upstream workforce – including
employees and contractors – is now 20%
smaller than it was in 2013, with a reduction of
around 4,000 expected in 2016. We are aiming
for an upstream workforce of approximately
20,000 by the end of 2016.
Downstream
In 2015 we reorganized our fuels business
from nine regions to three, streamlined the
lubricants business and started restructuring
petrochemicals. We are implementing
site-by-site improvement programmes to drive
manufacturing efficiency in refining and
petrochemicals. Our focus on third-party
spend has resulted in significant cost
reductions and we have reduced head office
related costs by around 40%.
These simplification and efficiency actions
have significantly contributed to the group’s
cash cost reductions in 2015.
We expect to reduce our downstream
workforce roles by more than 5,000 by the
end of 2017 compared with 2014, and by the
end of 2015 had already achieved a reduction
of more than 2,000.
Other businesses and corporate
We made significant progress in reducing
corporate and functional costs in 2015. We are
focusing on third-party spend and headcount
both in response to the lower oil price and also
to reflect the changes to our portfolio.
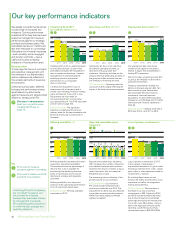
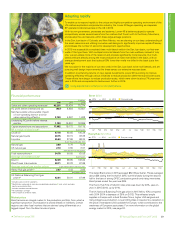
Optimize capital
expenditure
2015 organic capital expenditure
was $18.7 billion.
This is 18% down from the
2011-2014 period average.
We expect capital expenditure
of $17-19 billion per year in 2016
and 2017 as a result of reducing
costs and activity, with 2016
spend towards the lower end
of this range.
Reduce cash
costs
We made significant progress in
reducing cash costs compared with
2014.
We anticipate the reduction in
our cash costs to be close to
$7 billion versus 2014 by the
end of 2017.
Make selective
divestments
We completed the $10-billion
divestment programme
announced for 2014-2015.
We expect divestments of
$3-5 billion in 2016 and $2-3 billion
per year from 2017 to help manage
oil price volatility and fund the
ongoing Gulf of Mexico
commitments.
Maintain flexibility
around gearing
Gearing★ at the end of 2015 was
21.6% against a 2011-2014
average of 18%.
Looking ahead, we aim to
manage gearing with some
flexibility at around 20%. While
oil prices remain weak, we
expect gearing to be above 20%.
BP Annual Report and Form 20-F 2015
Strategic report
19