BP 2015 Annual Report Download - page 39
Download and view the complete annual report
Please find page 39 of the 2015 BP annual report below. You can navigate through the pages in the report by either clicking on the pages listed below, or by using the keyword search tool below to find specific information within the annual report.-
 1
1 -
2
-
3
-
4
-
5
-
6
-
7
-
8
-
9
-
10
-
11
-
12
-
13
-
14
-
15
-
16
-
17
-
18
-
19
-
20
-
21
-
22
-
23
-
24
-
25
-
26
-
27
-
28
-
 29
29 -
 30
30 -
 31
31 -
 32
32 -
 33
33 -
 34
34 -
 35
35 -
 36
36 -
 37
37 -
 38
38 -
 39
39 -
 40
40 -
 41
41 -
 42
42 -
 43
43 -
 44
44 -
 45
45 -
 46
46 -
 47
47 -
 48
48 -
 49
49 -
50
-
51
-
52
-
53
-
54
-
55
-
56
-
57
-
58
-
59
-
60
-
61
-
62
-
63
-
64
-
65
-
66
-
67
-
68
-
69
-
70
-
71
-
72
-
73
-
74
-
75
-
76
-
77
-
78
-
79
-
80
-
81
-
82
-
83
-
84
-
85
-
86
-
87
-
88
-
89
-
90
-
91
-
92
-
93
-
94
-
95
-
96
-
97
-
98
-
99
-
100
-
101
-
102
-
103
-
104
-
105
-
106
-
107
-
108
-
109
-
110
-
111
-
112
-
113
-
114
-
115
-
116
-
117
-
118
-
119
-
120
-
121
-
122
-
123
-
124
-
125
-
126
-
127
-
128
-
129
-
130
-
131
-
132
-
133
-
134
-
135
-
136
-
137
-
138
-
139
-
140
-
141
-
142
-
143
-
144
-
145
-
146
-
147
-
148
-
149
-
150
-
151
-
152
-
153
-
154
-
155
-
156
-
157
-
158
-
159
-
160
-
161
-
162
-
163
-
164
-
165
-
166
-
167
-
168
-
169
-
170
-
171
-
172
-
173
-
174
-
175
-
176
-
177
-
178
-
179
-
180
-
181
-
182
-
183
-
184
-
185
-
186
-
187
-
188
-
189
-
190
-
191
-
192
-
193
-
194
-
195
-
196
-
197
-
198
-
199
-
200
-
201
-
202
-
203
-
204
-
205
-
206
-
207
-
208
-
209
-
210
-
211
-
212
-
213
-
214
-
215
-
216
-
217
-
218
-
219
-
220
-
221
-
222
-
223
-
224
-
225
-
226
-
227
-
228
-
229
-
230
-
231
-
232
-
233
-
234
-
235
-
236
-
237
-
238
-
239
-
240
-
241
-
242
-
243
-
244
-
245
-
246
-
247
-
248
-
249
-
250
-
251
-
252
-
253
-
254
-
255
-
256
-
257
-
258
-
259
-
260
-
261
-
262
-
263
-
264
-
265
-
266
 |
 |

Financial performance
$ million
2015 2014 2013
Sale of crude oil through spot
and term contracts 38,386 80,003 79,394
Marketing, spot and term sales
of refined products 148,925 227,082 258,015
Other sales and operating revenues 13,258 16,401 13,786
Sales and other operating revenuesa 200,569 323,486 351,195
RC profit (loss) before interest and taxb
Fuels 5,858 2,830 1,518
Lubricants 1,241 1,407 1,274
Petrochemicals 12 (499) 127
7,111 3,738 2,919
Net (favourable) unfavourable impact
of non-operating items and fair
value accounting effects
Fuels 137 389 712
Lubricants 143 (136) (2)
Petrochemicals 154 450 3
434 703 713
Underlying RC profit (loss) before
interest and taxb
Fuels 5,995 3,219 2,230
Lubricants 1,384 1,271 1,272
Petrochemicals 166 (49) 130
7,545 4,441 3,632
Capital expenditure and acquisitions 2,109 3,106 4,506
a Includes sales to other segments.
b
Income from petrochemicals produced at our Gelsenkirchen and Mülheim sites is reported within
the fuels business. Segment-level overhead expenses are included within the fuels business.
Financial results
Sales and other operating revenues in 2015 were lower compared with
2014 due to lower crude prices. Similarly, the decrease in 2014, compared
with 2013 primarily was due to falling crude prices.
Replacement cost (RC) profit before interest and tax for the year ended
31 December 2015 included a net operating charge of $590 million, mainly
relating to restructuring charges. The 2014 result included a net non-
operating charge of $1,570 million, primarily relating to impairment charges
in our petrochemicals and fuels businesses, while the 2013 result included
impairment charges in our fuels business, which were mainly associated
with our disposal programme. In addition, fair value accounting effects had
a favourable impact of $156 million, compared with a favourable impact of
$867 million in 2014 and an unfavourable impact of $178 million in 2013.
After adjusting for non-operating items and fair value accounting effects,
underlying RC profit before interest and tax of $7,545 million in 2015 was a
record for Downstream.
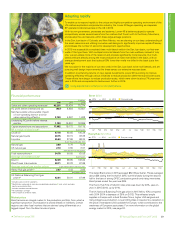
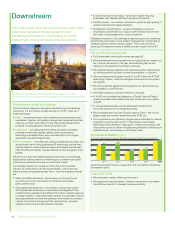
Our fuels business
The fuels strategy focuses primarily on fuels value chains (FVCs). This
includes building a top-quartile and focused refining business through
operating reliability, feedstock and location advantage and efficiency
improvements to our already competitively advantaged portfolio.
We believe that having a quality refining portfolio connected to strong
marketing positions is core to our integrated FVC businesses as this
provides optimization opportunities in highly competitive markets.
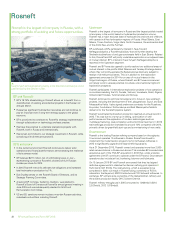
In January 2016 we announced that we signed definitive agreements to
dissolve our German refining joint operation with our partner Rosneft. The
restructuring will refocus our refining business in the heart of Europe and is
in line with our drive for greater simplification and efficiency.
We continue to grow our fuels marketing businesses, including retail,
through differentiated marketing offers and key partnerships. We partner
with leading retailers, creating distinctive offers that aim to deliver good
returns and reliable profit and cash generation (see page 13).
Underlying RC profit before interest and tax was higher compared with
2014 reflecting a strong refining environment, improved refining margin
optimization and operations, and lower costs from simplification and
efficiency programmes. Compared with 2013, the 2014 result was higher,
mainly due to improved fuels marketing performance, increased heavy
crude processing and higher production, mainly as a result of the ramp-up
of operations at our Whiting refinery following the modernization project.
This was partially offset by a weaker refining environment.
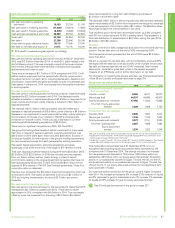
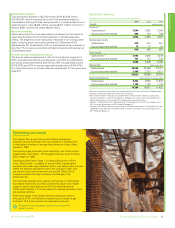
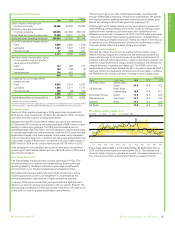
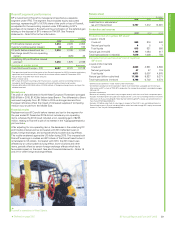
Refining marker margin
We track the margin environment by a global refining marker margin
(RMM). Refining margins are a measure of the difference between the
price a refinery pays for its inputs (crude oil) and the market price of its
products. Although refineries produce a variety of petroleum products, we
track the margin environment using a simplified indicator that reflects the
margins achieved on gasoline and diesel only. The RMM may not be
representative of the margin achieved by BP in any period because of BP’s
particular refinery configurations and crude and product slates. In addition,
the RMM does not include estimates of energy or other variable costs.
$ per barrel
Region Crude marker 2015 2014 2013
US North West Alaska North
Slope 24.0 16.6 15.2
US Midwest West Texas
Intermediate 19.0 17.4 21.7
Northwest Europe Brent 14.5 12.5 12.9
Mediterranean Azeri Light 12.7 10.6 10.5
Australia Brent 15.4 13.5 13.4
BP RMM 17.0 14.4 15.4
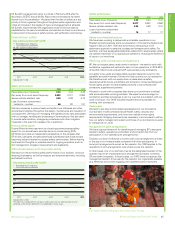
BP refining marker margin ($/bbl)
2014
2015
16
8
24
32
Jan Feb Mar Apr May Jun Jul Aug Sep Oct Nov Dec
2013 Five-year range
The average global RMM in 2015 was $17.0/bbl, $2.6/bbl higher than in
2014, and the second highest on record (after 2012). The increase was
driven by higher margins on gasoline as a result of increased demand in a
low oil price environment and persistent refinery outages in the US.
Defined on page 256.BP Annual Report and Form 20-F 2015 35
Strategic report