BP 2015 Annual Report Download - page 168
Download and view the complete annual report
Please find page 168 of the 2015 BP annual report below. You can navigate through the pages in the report by either clicking on the pages listed below, or by using the keyword search tool below to find specific information within the annual report.-
 1
1 -
2
-
3
-
4
-
5
-
6
-
7
-
8
-
9
-
10
-
11
-
12
-
13
-
14
-
15
-
16
-
17
-
18
-
19
-
20
-
21
-
22
-
23
-
24
-
25
-
26
-
27
-
28
-
29
-
30
-
31
-
32
-
33
-
34
-
35
-
36
-
37
-
38
-
39
-
40
-
41
-
42
-
43
-
44
-
45
-
46
-
47
-
48
-
49
-
50
-
51
-
52
-
53
-
54
-
55
-
56
-
57
-
58
-
59
-
60
-
61
-
62
-
63
-
64
-
65
-
66
-
67
-
68
-
69
-
70
-
71
-
72
-
73
-
74
-
75
-
76
-
77
-
78
-
79
-
80
-
81
-
82
-
83
-
84
-
85
-
86
-
87
-
88
-
89
-
90
-
91
-
92
-
93
-
94
-
95
-
96
-
97
-
98
-
99
-
100
-
101
-
102
-
103
-
104
-
105
-
106
-
107
-
108
-
109
-
110
-
111
-
112
-
113
-
114
-
115
-
116
-
117
-
118
-
119
-
120
-
121
-
122
-
123
-
124
-
125
-
126
-
127
-
128
-
129
-
130
-
131
-
132
-
133
-
134
-
135
-
136
-
137
-
138
-
139
-
140
-
141
-
142
-
143
-
144
-
145
-
146
-
147
-
148
-
149
-
150
-
151
-
152
-
153
-
154
-
155
-
156
-
157
-
 158
158 -
 159
159 -
 160
160 -
 161
161 -
 162
162 -
 163
163 -
 164
164 -
 165
165 -
 166
166 -
 167
167 -
 168
168 -
 169
169 -
 170
170 -
 171
171 -
 172
172 -
 173
173 -
 174
174 -
 175
175 -
 176
176 -
 177
177 -
 178
178 -
179
-
180
-
181
-
182
-
183
-
184
-
185
-
186
-
187
-
188
-
189
-
190
-
191
-
192
-
193
-
194
-
195
-
196
-
197
-
198
-
199
-
200
-
201
-
202
-
203
-
204
-
205
-
206
-
207
-
208
-
209
-
210
-
211
-
212
-
213
-
214
-
215
-
216
-
217
-
218
-
219
-
220
-
221
-
222
-
223
-
224
-
225
-
226
-
227
-
228
-
229
-
230
-
231
-
232
-
233
-
234
-
235
-
236
-
237
-
238
-
239
-
240
-
241
-
242
-
243
-
244
-
245
-
246
-
247
-
248
-
249
-
250
-
251
-
252
-
253
-
254
-
255
-
256
-
257
-
258
-
259
-
260
-
261
-
262
-
263
-
264
-
265
-
266
 |
 |

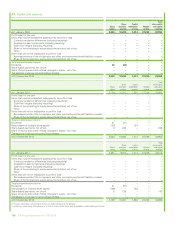
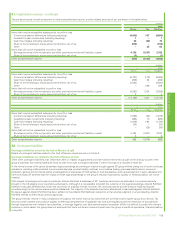
37. Condensed consolidating information on certain US subsidiaries – continued
Income statement continued
$ million
For the year ended 31 December 2014
Issuer Guarantor
BP
Exploration
(Alaska) Inc. BP p.l.c.
Other
subsidiaries
Eliminations and
reclassifications BP group
Sales and other operating revenues 6,227 – 353,529 (6,188) 353,568
Earnings from joint ventures – after interest and tax – – 570 – 570
Earnings from associates – after interest and tax – – 2,802 – 2,802
Equity-accounted income of subsidiaries – after interest and tax – 4,531 – (4,531) –
Interest and other income 2 193 910 (262) 843
Gains on sale of businesses and fixed assets 19 – 876 – 895
Total revenues and other income 6,248 4,724 358,687 (10,981) 358,678
Purchases 2,375 – 285,720 (6,188) 281,907
Production and manufacturing expenses 1,779 – 25,596 – 27,375
Production and similar taxes 554 – 2,404 – 2,958
Depreciation, depletion and amortization 545 – 14,618 – 15,163
Impairment and losses on sale of businesses and fixed assets 153 – 8,812 – 8,965
Exploration expense – – 3,632 – 3,632
Distribution and administration expenses 48 929 11,364 (75) 12,266
Profit (loss) before interest and taxation 794 3,795 6,541 (4,718) 6,412
Finance costs 57 23 1,255 (187) 1,148
Net finance (income) expense relating to pensions and other post-retirement
benefits – (50) 364 – 314
Profit (loss) before taxation 737 3,822 4,922 (4,531) 4,950
Taxation 279 42 626 – 947
Profit (loss) for the year 458 3,780 4,296 (4,531) 4,003
Attributable to
BP shareholders 458 3,780 4,073 (4,531) 3,780
Non-controlling interests – – 223 – 223
458 3,780 4,296 (4,531) 4,003
Statement of comprehensive income continued
$ million
For the year ended 31 December 2014
Issuer Guarantor
BP
Exploration
(Alaska) Inc. BP p.l.c.
Other
subsidiaries
Eliminations and
reclassifications BP group
Profit (loss) for the year 458 3,780 4,296 (4,531) 4,003
Other comprehensive income – (1,840) (10,875) – (12,715)
Equity-accounted other comprehensive income of subsidiaries – (10,843) – 10,843 –
Total comprehensive income 458 (8,903) (6,579) 6,312 (8,712)
Attributable to
BP shareholders 458 (8,903) (6,770) 6,312 (8,903)
Non-controlling interests – – 191 – 191
458 (8,903) (6,579) 6,312 (8,712)
164 BP Annual Report and Form 20-F 2015